 | |||||||||||||||||||||||||||||||||||||||||||||||||
21 of 63 seats to Trafford Metropolitan Borough Council 32 seats needed for a majority | |||||||||||||||||||||||||||||||||||||||||||||||||
|---|---|---|---|---|---|---|---|---|---|---|---|---|---|---|---|---|---|---|---|---|---|---|---|---|---|---|---|---|---|---|---|---|---|---|---|---|---|---|---|---|---|---|---|---|---|---|---|---|---|
| |||||||||||||||||||||||||||||||||||||||||||||||||
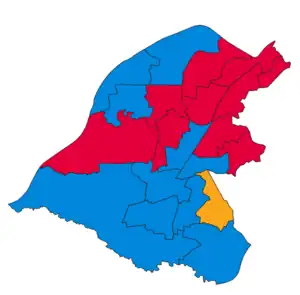 Map of results of 2003 election | |||||||||||||||||||||||||||||||||||||||||||||||||
| |||||||||||||||||||||||||||||||||||||||||||||||||
Elections to Trafford Council were held on 1 May 2003. One third of the council was up for election, with each successful candidate to serve a one-year term of office, expiring in 2004 due to the boundary changes and 'all-out' elections due to take place that year. The Labour Party lost overall control of the council, to no overall control.[1] Overall turnout was 52.3%.
Election result
| Party | Votes | Seats | Full Council | |||||||
| Labour Party | 30,192 (35.7%) | 10 (47.6%) | 10 / 21 |
31 (49.2%) | 31 / 63 | |||||
| Conservative Party | 38,792 (45.9%) | 10 (47.6%) | 10 / 21 |
29 (46.0%) | 29 / 63 | |||||
| Liberal Democrats | 11,371 (13.5%) | 1 (4.8%) | 1 / 21 |
3 (4.8%) | 3 / 63 | |||||
| Green Party | 3,688 (4.4%) | 0 (0.0%) | 0 / 21 |
0 (0.0%) | 0 / 63 | |||||
| Independent | 398 (0.5%) | 0 (0.0%) | 0 / 21 |
0 (0.0%) | 0 / 63 | |||||
| Socialist Labour Party | 81 (0.1%) | 0 (0.0%) | 0 / 21 |
0 (0.0%) | 0 / 63 | |||||
| 31 | 3 | 29 |
Ward results
Altrincham
| Party | Candidate | Votes | % | ±% | |
|---|---|---|---|---|---|
| Conservative | Alexander Williams | 2,634 | 58.7 | +4.2 | |
| Labour | David Armstrong | 1,212 | 27.0 | -5.0 | |
| Liberal Democrats | Roger Legge | 641 | 14.3 | +0.8 | |
| Majority | 1,422 | 31.7 | +9.2 | ||
| Turnout | 4,487 | 52.0 | -0.8 | ||
| Conservative hold | Swing | ||||
Bowdon
| Party | Candidate | Votes | % | ±% | |
|---|---|---|---|---|---|
| Conservative | Stephanie Poole* | 3,475 | 65.7 | +1.8 | |
| Liberal Democrats | Christopher Gaskill | 870 | 16.5 | +1.9 | |
| Labour | Helen Walsh | 535 | 10.1 | -4.6 | |
| Green | Bridget Green | 408 | 7.7 | +0.8 | |
| Majority | 2,605 | 49.2 | +0.0 | ||
| Turnout | 5,288 | 57.1 | +0.4 | ||
| Conservative hold | Swing | ||||
Broadheath
| Party | Candidate | Votes | % | ±% | |
|---|---|---|---|---|---|
| Conservative | Brenda Houraghan | 2,271 | 51.5 | +9.6 | |
| Labour | Ian Golding | 2,137 | 48.5 | -1.4 | |
| Majority | 134 | 3.0 | |||
| Turnout | 4,408 | 51.9 | -5.4 | ||
| Conservative gain from Labour | Swing | ||||
Brooklands
| Party | Candidate | Votes | % | ±% | |
|---|---|---|---|---|---|
| Conservative | Pamela Dixon* | 2,247 | 47.6 | -9.0 | |
| Liberal Democrats | Kenneth Clarke | 1,149 | 24.3 | +6.8 | |
| Labour | Joanne Bennett | 1,083 | 22.9 | -3.0 | |
| Green | Stephen Parker | 245 | 5.2 | +5.2 | |
| Majority | 1,098 | 23.3 | -7.4 | ||
| Turnout | 4,724 | 61.3 | +7.0 | ||
| Conservative hold | Swing | ||||
Bucklow
| Party | Candidate | Votes | % | ±% | |
|---|---|---|---|---|---|
| Labour | Ian Platt* | 1,749 | 74.7 | -0.6 | |
| Conservative | James Davies | 592 | 25.3 | +0.6 | |
| Majority | 1,157 | 49.4 | -1.2 | ||
| Turnout | 2,341 | 41.3 | +0.3 | ||
| Labour hold | Swing | ||||
Clifford
| Party | Candidate | Votes | % | ±% | |
|---|---|---|---|---|---|
| Labour | Eunice Stennett* | 1,714 | 55.3 | -20.5 | |
| Green | Anne Power | 854 | 27.6 | +17.7 | |
| Conservative | Roderick Allan | 532 | 17.2 | +2.8 | |
| Majority | 860 | 27.7 | -33.7 | ||
| Turnout | 3,100 | 41.9 | +1.9 | ||
| Labour hold | Swing | ||||
Davyhulme East
| Party | Candidate | Votes | % | ±% | |
|---|---|---|---|---|---|
| Conservative | Eric Crosbie* | 2,331 | 62.1 | +4.7 | |
| Labour | Nigel Roberts | 1,425 | 37.9 | -4.8 | |
| Majority | 906 | 24.2 | +9.5 | ||
| Turnout | 3,756 | 53.8 | +1.6 | ||
| Conservative hold | Swing | ||||
Davyhulme West
| Party | Candidate | Votes | % | ±% | |
|---|---|---|---|---|---|
| Conservative | John Reilly* | 2,525 | 60.1 | +8.4 | |
| Labour | Dolores O'Sullivan | 1,674 | 39.9 | -8.5 | |
| Majority | 851 | 20.2 | +16.9 | ||
| Turnout | 4,199 | 55.9 | -0.7 | ||
| Conservative hold | Swing | ||||
Flixton
| Party | Candidate | Votes | % | ±% | |
|---|---|---|---|---|---|
| Conservative | Jonathan Coupe* | 2,130 | 51.0 | -0.5 | |
| Labour | Karina Carter | 1,652 | 39.5 | -9.0 | |
| Independent | Paul Pickford | 398 | 9.5 | +9.5 | |
| Majority | 478 | 11.5 | +8.5 | ||
| Turnout | 4,180 | 57.1 | +3.3 | ||
| Conservative hold | Swing | ||||
Hale
| Party | Candidate | Votes | % | ±% | |
|---|---|---|---|---|---|
| Conservative | Patricia Morris | 3,078 | 64.5 | -4.6 | |
| Labour | Beverly Harrison | 794 | 16.7 | -0.5 | |
| Liberal Democrats | Jane Weightman | 676 | 14.2 | +0.4 | |
| Green | Samuel Little | 222 | 4.7 | +4.7 | |
| Majority | 2,288 | 47.8 | -4.1 | ||
| Turnout | 4,770 | 57.1 | -0.9 | ||
| Conservative hold | Swing | ||||
Longford
| Party | Candidate | Votes | % | ±% | |
|---|---|---|---|---|---|
| Labour | David Jarman* | 1,708 | 49.7 | -12.6 | |
| Conservative | Geoffrey Harding | 1,233 | 35.9 | -1.8 | |
| Green | Bernard Kelly | 497 | 14.5 | +14.5 | |
| Majority | 475 | 13.8 | -10.8 | ||
| Turnout | 3,438 | 48.4 | -0.1 | ||
| Labour hold | Swing | ||||
Mersey-St. Mary's
| Party | Candidate | Votes | % | ±% | |
|---|---|---|---|---|---|
| Conservative | John Lamb | 2,877 | 54.4 | -1.4 | |
| Labour | Sophie Taylor | 1,548 | 29.3 | -1.7 | |
| Liberal Democrats | Graham Rogers | 779 | 14.7 | +1.5 | |
| Socialist Labour | James Flannery | 81 | 1.5 | +1.5 | |
| Majority | 1,329 | 25.1 | +0.3 | ||
| Turnout | 5,285 | 55.8 | +1.2 | ||
| Conservative hold | Swing | ||||
Park
| Party | Candidate | Votes | % | ±% | |
|---|---|---|---|---|---|
| Labour | Mary Strickland | 1,604 | 61.5 | -1.3 | |
| Conservative | John Schofield | 1,006 | 38.5 | +1.3 | |
| Majority | 598 | 23.0 | -2.6 | ||
| Turnout | 2,610 | 44.0 | -2.8 | ||
| Labour hold | Swing | ||||
Priory
| Party | Candidate | Votes | % | ±% | |
|---|---|---|---|---|---|
| Labour | Barbara Keeley* | 1,620 | 40.9 | -7.6 | |
| Conservative | Daniel Bunting | 1,198 | 30.2 | +0.2 | |
| Liberal Democrats | Michael Riley | 907 | 22.9 | +1.4 | |
| Green | Steven Flower | 241 | 6.1 | +6.1 | |
| Majority | 422 | 10.7 | -7.8 | ||
| Turnout | 3,966 | 54.6 | +3.3 | ||
| Labour hold | Swing | ||||
Sale Moor
| Party | Candidate | Votes | % | ±% | |
|---|---|---|---|---|---|
| Labour | Munaver Rasul* | 1,385 | 36.0 | -11.5 | |
| Conservative | Pervez Nakvi | 1,247 | 32.4 | -0.3 | |
| Liberal Democrats | Margaret Clarke | 1,212 | 31.5 | +17.4 | |
| Majority | 138 | 3.6 | -11.2 | ||
| Turnout | 3,844 | 50.7 | -2.5 | ||
| Labour hold | Swing | ||||
St. Martin's
| Party | Candidate | Votes | % | ±% | |
|---|---|---|---|---|---|
| Labour | David Quayle* | 2,148 | 51.2 | -15.2 | |
| Conservative | Colin Foster | 1,461 | 34.8 | +1.2 | |
| Liberal Democrats | Richard Elliott | 584 | 13.9 | +13.9 | |
| Majority | 687 | 16.4 | -16.4 | ||
| Turnout | 4,193 | 53.3 | +3.5 | ||
| Labour hold | Swing | ||||
Stretford
| Party | Candidate | Votes | % | ±% | |
|---|---|---|---|---|---|
| Labour | Bernice Garlick* | 1,987 | 54.2 | -4.1 | |
| Conservative | George Manley | 1,331 | 36.3 | -0.5 | |
| Green | Antony Quinn | 350 | 9.5 | +9.5 | |
| Majority | 656 | 17.9 | -3.6 | ||
| Turnout | 3,668 | 49.1 | -1.7 | ||
| Labour hold | Swing | ||||
Talbot
| Party | Candidate | Votes | % | ±% | |
|---|---|---|---|---|---|
| Labour | Pauleen Lane* | 1,505 | 60.8 | -16.4 | |
| Conservative | Colin Levenston | 570 | 23.0 | +0.2 | |
| Green | Angela Hall | 401 | 16.2 | +16.2 | |
| Majority | 935 | 37.8 | -16.6 | ||
| Turnout | 2,476 | 40.2 | +2.3 | ||
| Labour hold | Swing | ||||
Timperley
| Party | Candidate | Votes | % | ±% | |
|---|---|---|---|---|---|
| Conservative | Mauline Akins* | 2,461 | 54.0 | +0.6 | |
| Liberal Democrats | Catherine Smith | 2,099 | 46.0 | -0.6 | |
| Majority | 362 | 8.0 | +1.2 | ||
| Turnout | 4,560 | 52.5 | +0.1 | ||
| Conservative hold | Swing | ||||
Urmston
| Party | Candidate | Votes | % | ±% | |
|---|---|---|---|---|---|
| Labour | Joyce Acton* | 1,912 | 45.6 | -11.2 | |
| Conservative | Christine Turner | 1,808 | 43.2 | +0.0 | |
| Green | Helen Jocys | 470 | 11.2 | +11.2 | |
| Majority | 104 | 2.4 | -11.2 | ||
| Turnout | 4,190 | 56.6 | +2.6 | ||
| Labour hold | Swing | ||||
Village
| Party | Candidate | Votes | % | ±% | |
|---|---|---|---|---|---|
| Liberal Democrats | Jane Brophy | 2,454 | 48.7 | -16.4 | |
| Conservative | David Pate | 1,785 | 35.4 | +0.5 | |
| Labour | Martin Williams | 800 | 15.9 | +15.9 | |
| Majority | 669 | 13.3 | -16.9 | ||
| Turnout | 5,039 | 54.3 | +3.7 | ||
| Liberal Democrats hold | Swing | ||||
References
- ↑ "Local elections". BBC News Online. Retrieved 18 December 2009.
This article is issued from Wikipedia. The text is licensed under Creative Commons - Attribution - Sharealike. Additional terms may apply for the media files.