| Indiana's 5th congressional district | |||
|---|---|---|---|
.png.webp) Indiana's 5th congressional district since January 3, 2023 | |||
| Representative |
| ||
| Area | 3,266.14 sq mi (8,459.3 km2) | ||
| Distribution |
| ||
| Population (2022) | 772,783 | ||
| Median household income | $75,915[1] | ||
| Ethnicity |
| ||
| Cook PVI | R+11[2] | ||
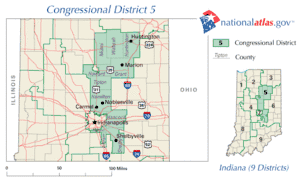
Indiana's 5th congressional district is a congressional district in the U.S. state of Indiana comprising Hamilton, Madison, Delaware, Grant, and Tipton counties, as well as the large majority of Howard County. Much of its population is located in the northern suburbs of Indianapolis, including the cities of Carmel, Noblesville, and Fishers, while other population centers include Muncie, Kokomo, Anderson, and Marion. The district is predominantly white and is the wealthiest congressional district in Indiana, as measured by median income.
The district is currently represented by Republican Victoria Spartz.
Demographics
According to the APM Research Lab's Voter Profile Tools[3] (featuring the U.S. Census Bureau's 2019 American Community Survey), the district contained about 585,000 potential voters (citizens, age 18+). Of these, 84% are White and 8% are Black. Immigrants make up 4% of the district's potential voters. Median income among households (with one or more potential voter) in the district is about $76,700, while 7% of households live below the poverty line. As for the educational attainment of potential voters in the district, 45% hold a bachelor's or higher degree.
Composition
| # | County | Seat | Population |
|---|---|---|---|
| 35 | Delaware | Muncie | 111,871 |
| 53 | Grant | Marion | 66,263 |
| 57 | Hamilton | Noblesville | 356,650 |
| 67 | Howard | Kokomo | 83,687 |
| 95 | Madison | Anderson | 130,782 |
| 73 | Tipton | Tipton | 15,372 |
Largest cities
Largest cities in the district, listing every city that had at least 10,000 inhabitants as of the 2020 census.
- Carmel - 100,777
- Fishers - 98,977
- Muncie - 65,194
- Noblesville - 64,668
- Kokomo - 59,604
- Anderson - 56,129
- Westfield - 46,410
- Marion - 29,948
- Yorktown - 11,548
As of 2022, Indiana's 5th congressional district is located in central Indiana. It includes Delaware, Grant, Hamilton, Howard, Madison, and Tipton Counties.
Recent election results from statewide races
| Year | U.S. President | U.S. Senator[4] | Governor |
|---|---|---|---|
| 2000 | Bush (R): 69 – 30% | [Data unknown/missing] | [Data unknown/missing] |
| 2004 | Bush (R): 71 – 28% | [Data unknown/missing] | [Data unknown/missing] |
| 2008 | McCain (R): 59 – 40% | — | [Data unknown/missing] |
| 2012 | Romney (R): 58 – 41% | Donnelly (D): 47 – 46% | Pence (R): 55 - 40% |
| 2016 | Trump (R): 53 – 41% | [Data unknown/missing] | [Data unknown/missing] |
| 2018 | — | Braun (R): 48 – 48% | — |
| 2020 | Trump (R): 50 – 48% | — | [Data unknown/missing] |
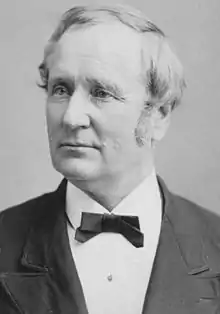
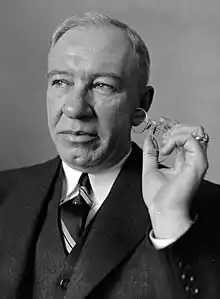
List of members representing the district


.jpg.webp)


.jpg.webp)


.jpg.webp)

.jpg.webp)
.jpg.webp)

.jpg.webp)

.jpg.webp)

.tif.png.webp)

Election results
2002
| Party | Candidate | Votes | % | |
|---|---|---|---|---|
| Republican | Dan Burton* | 129,442 | 71.97 | |
| Democratic | Katherine Fox Carr | 45,283 | 25.18 | |
| Libertarian | Christopher Adkins | 5,130 | 2.85 | |
| Total votes | 179,855 | 100.00 | ||
| Turnout | ||||
| Republican hold | ||||
2004
| Party | Candidate | Votes | % | |
|---|---|---|---|---|
| Republican | Dan Burton* | 228,718 | 71.84 | |
| Democratic | Katherine Fox Carr | 82,637 | 25.96 | |
| Libertarian | Rick Hodgin | 7,008 | 2.20 | |
| Total votes | 318,363 | 100.00 | ||
| Turnout | ||||
| Republican hold | ||||
2006
| Party | Candidate | Votes | % | |
|---|---|---|---|---|
| Republican | Dan Burton* | 133,118 | 64.96 | |
| Democratic | Katherine Fox Carr | 64,362 | 31.41 | |
| Libertarian | Sheri Conover Sharlow | 7,431 | 3.63 | |
| Total votes | 204,821 | 100.00 | ||
| Turnout | ||||
| Republican hold | ||||
2008
| Party | Candidate | Votes | % | |
|---|---|---|---|---|
| Republican | Dan Burton* | 234,507 | 65.59 | |
| Democratic | Mary Etta Ruley | 123,021 | 34.41 | |
| Total votes | 357,528 | 100.00 | ||
| Turnout | ||||
| Republican hold | ||||
2010
| Party | Candidate | Votes | % | |
|---|---|---|---|---|
| Republican | Dan Burton* | 146,899 | 62.14 | |
| Democratic | Tim Crawford | 60,024 | 25.39 | |
| Libertarian | Richard Reid | 18,266 | 7.73 | |
| Independent | Jesse C. Trueblood | 11,218 | 4.75 | |
| Total votes | 236,407 | 100.00 | ||
| Turnout | ||||
| Republican hold | ||||
2012
| Party | Candidate | Votes | % | |
|---|---|---|---|---|
| Republican | Susan Brooks | 194,570 | 58.37 | |
| Democratic | Scott Reske | 125,347 | 37.60 | |
| Libertarian | Chard Reid | 13,442 | 4.03 | |
| Total votes | 333,359 | 100.00 | ||
| Turnout | 58 | |||
| Republican hold | ||||
2014
| Party | Candidate | Votes | % | |
|---|---|---|---|---|
| Republican | Susan Brooks* | 105,277 | 65.21 | |
| Democratic | Shawn Denney | 49,756 | 30.82 | |
| Libertarian | John Krom | 6,407 | 3.97 | |
| Total votes | 161,440 | 100.00 | ||
| Turnout | 26 | |||
| Republican hold | ||||
2016
| Party | Candidate | Votes | % | |
|---|---|---|---|---|
| Republican | Susan Brooks* | 221,957 | 61.46 | |
| Democratic | Angela Demaree | 123,849 | 34.29 | |
| Libertarian | Matthew Wittlief | 15,329 | 4.24 | |
| Total votes | 361,135 | 100.00 | ||
| Turnout | 57 | |||
| Republican hold | ||||
2018
| Party | Candidate | Votes | % | |
|---|---|---|---|---|
| Republican | Susan Brooks* | 180,035 | 56.76 | |
| Democratic | Dee Thornton | 137,142 | 43.24 | |
| Total votes | 317,177 | 100.00 | ||
| Turnout | ||||
| Republican hold | ||||
2020
| Party | Candidate | Votes | % | |
|---|---|---|---|---|
| Republican | Victoria Spartz | 208,053 | 50.0 | |
| Democratic | Christina Hale | 190,898 | 45.9 | |
| Libertarian | Ken Tucker | 16,764 | 4.0 | |
| Total votes | 415,718 | 100.0 | ||
| Republican hold | ||||
2022
| Party | Candidate | Votes | % | |
|---|---|---|---|---|
| Republican | Victoria Spartz* | 146,575 | 61.1 | |
| Democratic | Jeanine Lee Lake | 93,434 | 38.9 | |
| Total votes | 240,009 | 100.0 | ||
| Republican hold | ||||
See also
References
- ↑ Center for New Media & Promotion (CNMP), US Census Bureau. "My Congressional District". www.census.gov.
- ↑ "2022 Cook PVI: District Map and List". Cook Political Report. Retrieved January 10, 2023.
- ↑ "Representing US: 2020 Voter Profiles". APM Research Lab. Retrieved October 22, 2020.
- ↑ "IN-05 Senate Elections 2012 and 2018". Twitter. Retrieved July 3, 2020.
External links
- Martis, Kenneth C. (1989). The Historical Atlas of Political Parties in the United States Congress. New York: Macmillan Publishing Company.
- Martis, Kenneth C. (1982). The Historical Atlas of United States Congressional Districts. New York: Macmillan Publishing Company.
- Congressional Biographical Directory of the United States 1774–present