| |||||||||||||||||||||||||||||||||||||||||||||
All 533 English seats to the House of Commons | |||||||||||||||||||||||||||||||||||||||||||||
|---|---|---|---|---|---|---|---|---|---|---|---|---|---|---|---|---|---|---|---|---|---|---|---|---|---|---|---|---|---|---|---|---|---|---|---|---|---|---|---|---|---|---|---|---|---|
| |||||||||||||||||||||||||||||||||||||||||||||
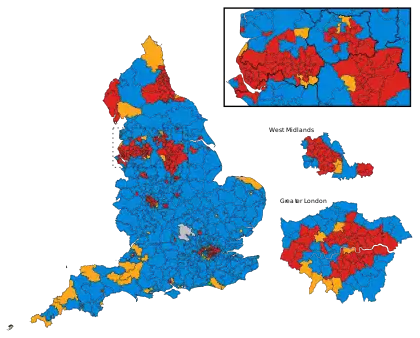 A map of English parliamentary constituencies *Seat figure does not include the Speaker of the House of Commons, John Bercow, who was included in the Conservative seat total by some media outlets. †Owing to electoral boundaries changing, this figure is notional. | |||||||||||||||||||||||||||||||||||||||||||||

.jpg.webp)

These are the results of the 2010 United Kingdom general election in England. The election was held on 6 May 2010 and all 533 seats in England were contested. The Conservative Party achieved a complete majority of English seats, but fared less well in Scotland and Wales, so a coalition government was subsequently formed between the Conservatives and the Liberal Democrats.
Results table
| Party[2] | Seats | Votes | |||||||
|---|---|---|---|---|---|---|---|---|---|
| Total | Gains | Losses | Net +/- | % seats | Total votes | % votes | Change | ||
| Conservative | 297 | 95 | 4 | 55.7 | 9,908,169 | 39.5 | |||
| Labour | 191 | 2 | 89 | 35.8 | 7,042,398 | 28.1 | |||
| Liberal Democrats | 43 | 8 | 12 | 8.1 | 6,076,189 | 24.2 | |||
| UKIP | 0 | 0 | 0 | — | 866,633 | 3.5 | |||
| BNP | 0 | 0 | 0 | — | 532,333 | 2.1 | |||
| Green | 1 | 0 | 0 | 0.2 | 258,954 | 1.0 | |||
| English Democrat | 0 | 0 | 0 | — | 64,826 | 0.3 | |||
| Respect | 0 | 0 | 0 | — | 33,251 | 0.1 | |||
| Speaker | 1 | 1 | 0 | 0.2 | 22,860 | 0.1 | |||
| Health Concern | 0 | 0 | 0 | — | 16,150 | 0.1 | |||
| Christian | 0 | 0 | 0 | 0 | — | 15,841 | 0.1 | N/A | |
| National Front | 0 | 0 | 0 | 0 | — | 10,400 | 0.0 | ||
| TUSC | 0 | 0 | 0 | 0 | — | 8,404 | 0.0 | N/A | |
| Socialist Labour | 0 | 0 | 0 | 0 | — | 4,368 | 0.0 | ||
| Other parties | 0 | 0 | 0 | 0 | — | 224,341 | 0.9 | ||
| 25,085,097 | 65.5 | ||||||||
Regional results
Regional vote shares and changes are sourced from the BBC.[3]
East Midlands
| Party | Seats | Votes | ||||||
|---|---|---|---|---|---|---|---|---|
| Total | Gained | Lost | Net | Total | % | Change (%) | ||
| Conservative | 31 | 12 | - | +12 | 915,933 | 41.2 | +4.1 | |
| Labour | 15 | 1 | 12 | -11 | 661,813 | 29.8 | -9.2 | |
| Liberal Democrats | - | - | 1 | -1 | 462,988 | 20.8 | +2.4 | |
| UKIP | - | - | - | - | 72,659 | 3.3 | +0.6 | |
| BNP | - | - | - | - | 69,706 | 3.1 | +2.6 | |
| Others | - | - | - | - | 41,044 | 1.8 | — | |
| Total | 46 | Turnout | 2,224,143 | 66.5 | ||||
East of England
| Party | Seats | Votes | ||||||
|---|---|---|---|---|---|---|---|---|
| Total | Gained | Lost | Net | Total | % | Change (%) | ||
| Conservative | 52 | 10 | - | +10 | 1,356,739 | 47.1 | +3.8 | |
| Liberal Democrats | 4 | 1 | - | +1 | 692,932 | 24.1 | +2.2 | |
| Labour | 2 | - | 11 | -11 | 564,581 | 19.6 | -10.2 | |
| UKIP | - | - | - | − | 123,237 | 4.3 | +1.1 | |
| Others | - | - | - | - | 141,638 | 4.9 | — | |
| Total | 58 | Turnout | 2,879,117 | 67.3 | ||||
London
| Party | Seats | Votes | ||||||
|---|---|---|---|---|---|---|---|---|
| Total | Gained | Lost | Net | Total | % | Change (%) | ||
| Labour | 38 | 1 | 7 | -6 | 1,245,637 | 36.6 | -2.3 | |
| Conservative | 28 | 7 | - | +7 | 1,174,568 | 34.5 | +2.6 | |
| Liberal Democrats | 7 | 1 | 1 | - | 751,561 | 22.1 | +0.2 | |
| UKIP | - | - | - | − | 59,452 | 1.7 | +0.3 | |
| Green | - | - | - | − | 54,316 | 1.6 | -1.1 | |
| BNP | - | - | - | − | 52,095 | 1.5 | +0.9 | |
| Respect | - | - | 1 | -1 | 17,368 | 0.5 | -0.9 | |
| Others | - | - | - | - | 46,320 | 1.3 | — | |
| Total | 73 | Turnout | 3,401,317 | 64.6 | ||||
North East
| Party | Seats | Votes | ||||||
|---|---|---|---|---|---|---|---|---|
| Total | Gained | Lost | Net | Total | % | Change (%) | ||
| Labour | 25 | - | 2 | -2 | 518,261 | 43.6 | -9.3 | |
| Conservative | 2 | 1 | - | +1 | 282,347 | 23.7 | +4.2 | |
| Liberal Democrats | 2 | 1 | - | +1 | 280,468 | 23.6 | +0.2 | |
| BNP | - | - | - | − | 51,940 | 4.4 | +3.5 | |
| Others | - | - | - | - | 56,907 | 4.7 | — | |
| Total | 29 | Turnout | 1,189,923 | 60.9 | ||||
North West
| Party | Seats | Votes | ||||||
|---|---|---|---|---|---|---|---|---|
| Total | Gained | Lost | Net | Total | % | Change (%) | ||
| Labour | 47 | - | 13 | -13 | 1,292,978 | 39.5 | -5.6 | |
| Conservative | 22 | 12 | - | +12 | 1,038,967 | 31.7 | +3.0 | |
| Liberal Democrats | 6 | 1 | - | +1 | 707,770 | 21.6 | +0.2 | |
| UKIP | - | - | - | − | 103,782 | 3.2 | +1.2 | |
| Others | - | - | - | - | 132,733 | 4.0 | — | |
| Total | 75 | Turnout | 3,276,230 | 63.6 | ||||
South East
| Party | Seats | Votes | ||||||
|---|---|---|---|---|---|---|---|---|
| Total | Gained | Lost | Net | Total | % | Change (%) | ||
| Conservative | 75 | 15 | 1 | +14 | 2,140,895 | 49.9 | +4.9 | |
| Liberal Democrats | 4 | 1 | 3 | -2 | 1,124,786 | 26.2 | +0.8 | |
| Labour | 4 | - | 13 | -13 | 697,567 | 16.2 | -8.1 | |
| Green | 1 | 1 | - | 1 | 62,124 | 1.4 | +0.1 | |
| UKIP | - | - | - | - | 177,269 | 4.1 | +1.0 | |
| Others | - | - | - | - | 91,599 | 2.2 | — | |
| Total | 84 | Turnout | 4,294,240 | 68.0 | ||||
South West
| Party | Seats | Votes | ||||||
|---|---|---|---|---|---|---|---|---|
| Total | Gained | Lost | Net | Total | % | Change (%) | ||
| Conservative | 36 | 12 | 1 | +11 | 1,187,637 | 42.8 | +4.2 | |
| Liberal Democrats | 15 | 1 | 4 | -3 | 962,954 | 34.7 | +2.2 | |
| Labour | 4 | - | 8 | -8 | 426,910 | 15.4 | -7.4 | |
| UKIP | - | - | - | - | 123,975 | 4.5 | +0.7 | |
| Others | - | - | - | - | 71,967 | 2.6 | — | |
| Total | 55 | Turnout | 2,773,443 | 69.1 | ||||
West Midlands
| Party | Seats | Votes | ||||||
|---|---|---|---|---|---|---|---|---|
| Total | Gained | Lost | Net | Total | % | Change (%) | ||
| Conservative | 33 | 16 | 1 | +15 | 1,044,081 | 39.5 | +4.5 | |
| Labour | 24 | - | 14 | -14 | 808,114 | 30.6 | -8.9 | |
| Liberal Democrats | 2 | 1 | 1 | - | 540,160 | 20.5 | +1.9 | |
| UKIP | - | - | - | − | 105,685 | 4.0 | +0.8 | |
| BNP | - | - | - | - | 73,394 | 2.8 | +1.0 | |
| Health Concern | - | - | 1 | -1 | 16,150 | 0.6 | -0.2 | |
| Others | - | - | - | - | 52,881 | 2.1 | — | |
| Total | 59 | Turnout | 2,640,465 | 64.6 | ||||
Yorkshire and Humber
| Party | Seats | Votes | ||||||
|---|---|---|---|---|---|---|---|---|
| Total | Gained | Lost | Net | Total | % | Change (%) | ||
| Labour | 32 | - | 9 | -9 | 821,368 | 34.7 | -9.3 | |
| Conservative | 18 | 10 | - | +10 | 769,895 | 32.5 | +3.9 | |
| Liberal Democrats | 3 | 1 | 2 | -1 | 543,684 | 23.0 | +2.2 | |
| BNP | - | - | - | - | 104,177 | 4.4 | +1.6 | |
| Others | - | - | - | - | 129,153 | 5.4 | — | |
| Total | 53 | Turnout | 2,368,277 | 63.2 | ||||
See also
References
This article is issued from Wikipedia. The text is licensed under Creative Commons - Attribution - Sharealike. Additional terms may apply for the media files.