COVID-19/All-cause deaths/Sweden
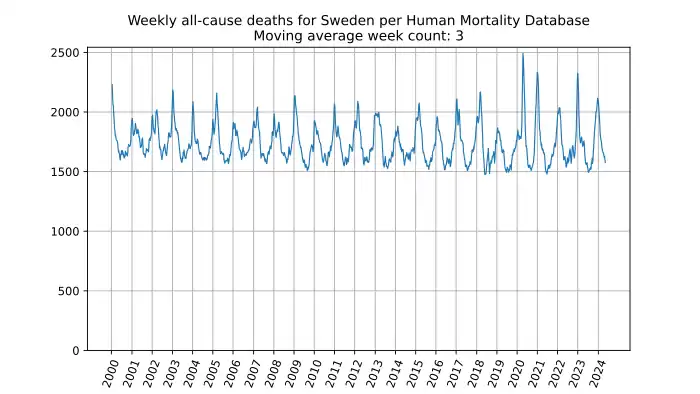
Weekly all-cause deaths in Sweden, based on mortality.org data, stmf.csv, 3-week average:
Weekly all-cause deaths in Sweden for 0-14 year olds, based on mortality.org data, stmf.csv, 7-week average:

All-cause deaths in Sweden in weeks 1-16, year by year, based on mortality.org data, stmf.csv:
mortality.org indicates the data for the last weeks to be preliminary; above, the last two weeks available from mortality.org were excluded to prevent the worst effect of registration delay. The above is not adjusted by population size.
All-cause deaths in Sweden in weeks 40+ the year before and weeks 1-16 of the year, year by year, based on mortality.org data, stmf.csv::
mortality.org indicates the data for the last weeks to be preliminary; above, the last two weeks available from mortality.org were excluded to prevent the worst effect of registration delay. The above is not adjusted by population size.
All-cause death excess percentage in Sweden, year by year, based on mortality.org data, stmf.csv:
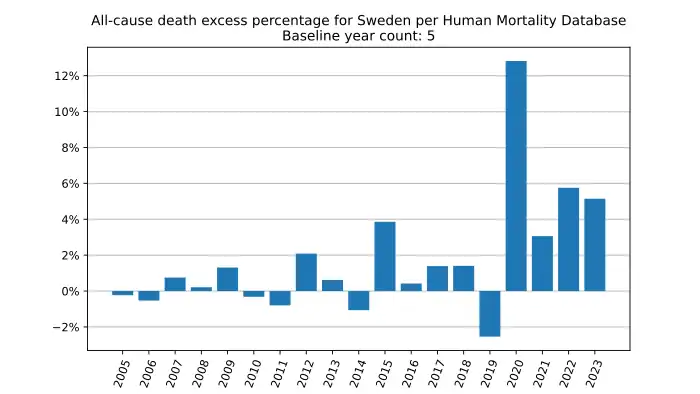
Above, the minimum over previous last 5 years is taken as the baseline against which the excess is calculated, and the last year is dropped as incomplete.
All-cause deaths in Sweden in Oct–May, calculated from SCB , for 1900–2020:
Above, each year on the x-axis is the year of Jan–May data, while Oct–Dec data are for the previous year. Beware that the above is not adjusted for population.
Weekly all-cause deaths in Sweden for 2015–2020 by county, calculated from Socialstyrelsen , (Smoothened by 4-weeks moving average)
Swedish yearly number of death by age (by year of birth) per 100 000 inhabitants of the same age. Calculated as: mortality_rate_per100K_31_dec(year, age) = 100K * absolute_mortality_31_dec(year, age) / population_1_jan(year, age-1) (similar dataset but with 5 years age groups available at SCB: )
Swedish yearly population by age (on 1 January each year)
Swedish yearly number of death by age (the year of birth)
Comparison between actual Swedish yearly number of death, and calculated values obtained by applying each year actual death rates to 2020 Swedish population structure (data with calculations also available at )
Script oneliners to update the charts:
- plotHmd.py stmf.csv SWE DTotal 3 --svg
- plotHmd.py stmf.csv SWE D0_14 7 --svg
- plotHmdPerYear.py stmf.csv SWE DTotal
- plotHmdPerSeason.py stmf.csv SWE DTotal
- plotHmdExcessDeathPercPerYear.py stmf.csv SWE DTotal 5 --svg
See also:
External links:
- mpidr.shinyapps.io/stmortality
- Graphs and maps — EUROMOMO, euromomo.eu - mortality monitoring in Europe
- Comparisons of all-cause mortality between European countries and regions: January to June 2020, ons.gov.uk
- W:COVID-19 pandemic in Sweden, wikipedia.org