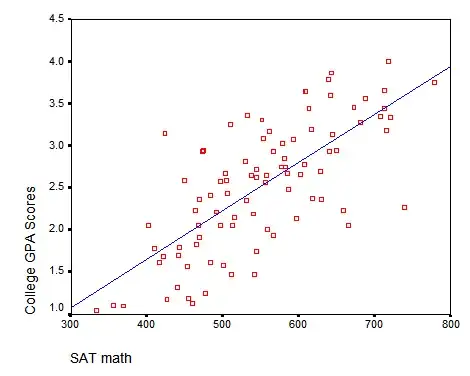
What if I have some data, let's say I'm trying to answer if education level and IQ affect earnings, and I want to analyze this data and put in a regression model to predict earnings based on the IQ and education level. My confusion is, what if the data is not linear or polynomial? What if it's a mess but there are still patterns that the linear plane algorithm can't capture? How do I figure out if plotting all of the independent variables will form a line or a polynomial curve like here?
I mean, with one dependent and one independent variable it's easy because you can plot it and see, but in a situation with multiple independent variables... how do I figure out if the relationship is linear or something like this? How do I figure out if I should use a regression model?
Let's say I want to predict a store's daily revenue based on the day of the week, weather and the number of people arrived in the city. My data would look something like this:
+-----------+---------+----------------+---------+
| DAY       | WEATHER | PEOPLE ARRIVED | REVENUE |
+-----------+---------+----------------+---------+
| Monday    | Sunny   | 1115           | $500    |
+-----------+---------+----------------+---------+
| Tuesday   | Cloudy  | 808            | $250    |
+-----------+---------+----------------+---------+
| Wednesday | Sunny   | 450            | $300    |
+-----------+---------+----------------+---------+
I'm a bit confused about what ML algorithm I should use in such a scenario. I can represent the days of the week as (Monday - 1, Tuesday - 2, Wednesday - 3, etc.) and the weather as (Sunny - 1, Cloudy - 2, Normal - 3, etc.) but would a regression model work? I'm skeptical because I'm not sure if there's a linear relationship between the variables and I'm not sure if a hyperplane can create accurate representation of what's going on.


