I have data of 30 students attendance for a particular subject class for a week. I have quantified the absence and presence with boolean logic 0 and 1. Also, the reason for absence are provided and I tried to generalise these reason into 3 categories say A, B and C. Now I want to use these data to make future predictions for attendance but I am uncertain of what technique to use. Can anyone please provide suggestions?
-
2I don't think a week is long enough to form an accurate picture of student behaviour. Attendance tends to be better in the first and last weeks, and any classes that are flagged in advance as containing material guaranteed to be covered in the exam. I would expect the pattern to be different from week to week. You could probably come up with reasonable predictions for Week 1, based on data from Week 1, and so on. – Jnani Jenny Hale Dec 03 '16 at 09:14
-
I would add that illness, accident, death of a relative, etc absences would probably have a Poisson distribution. – Jnani Jenny Hale Dec 03 '16 at 09:15
2 Answers
I suggest you should use AI Regression Model for future predictions for an attendance of students. Because of this technique or model design for future predictions.
Follow this to get more information about regression type and methodology
- 121
- 1
-
1One week of data would not give enough material for any kind of accurate regression model. – Jnani Jenny Hale Dec 03 '16 at 12:10
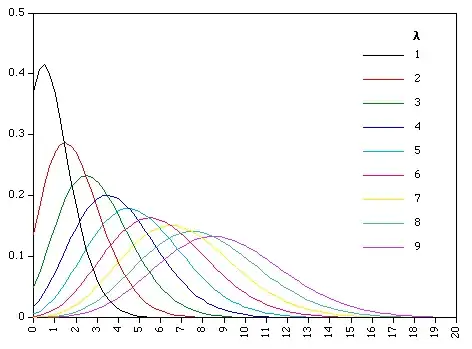
Because you have a small number of students (30), and a short time (one week), the number of absences is likely to be best modelled as a Poisson distribution.
Poisson Formula
The average number of absences within a given time period is μ (use your data to estimate this).
Then, the Poisson probability of x absences is:
P(x; μ) = (e-μ) (μx) / x!
where e is the logarithmic constant, approximately equal to 2.71828.
You can either:
model absences due to the three reasons as three separate probablilites, P(A), P(B), and P(C), and then combine them, or
model total absences as one figure.
Given your very small data set, the first approach is likely to be less accurate.
- 521
- 2
- 10
-
-
You can calculate the probability of x absences in any given class, for each possible value of x (note that they will approach zero rapidly as x gets larger - it is extremely unlikely that 20 of the 30 students will be absent on the same day). Of course, this type of probability takes no account of factors like long weekends, due dates of major assignments in other subjects, epidemics of flu in the dorms, a batch of bad ecstasy hitting campus, or whatever other event might change the base assumptions of the model. – Jnani Jenny Hale Dec 03 '16 at 12:31
-
Hi, can you kindly have a look at my data? And also I am having difficulty modelling data after separate probabilities. (option 1) link: https://drive.google.com/file/d/0BzfsRJ1EQT-tQUpLem1qcDBsdVk/view?usp=sharing – Ayan Paul Dec 04 '16 at 01:29
-
Rather than "average presence per student", use "number of students absent" as your metric. You can calculate the probablility of zero absences, one, 2, 3, etc. With 30 students, the probabilities will get low very quickly. You most likely results will be 0,1 and 2. – Jnani Jenny Hale Dec 12 '16 at 02:07
