1

I am following a course on machine learning and am confused about the bias-variance trade-off relationship to learning curves in classification.

I am seeing some conflicting information online on this.

The scikit-learn learning curve looks like the top 2 curves here: Learning curve
(source: scikit-learn.org)

What I don't understand is: how do we read bias from this? If we look at this image where each blue dot is a model. I think the bias would be the green curve being high. But high bias indicates underfitting, right? So shouldn't the red curve be high then too?

Bias variance tradeoff

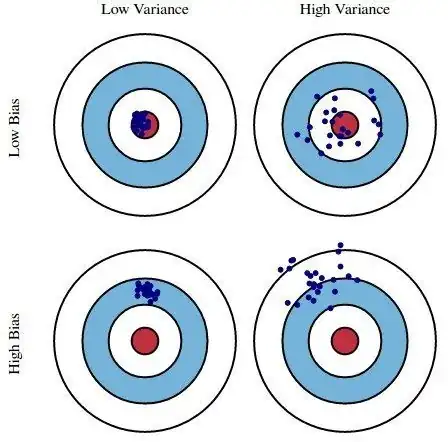
High variance would be the gap between green and red, is this correct?

My question is how do the red and green curves relate to underfitting and overfitting, and how do learning curves fit with the figure with the concentric circles? Is bias purely related to the red curve, or is a model with a low validation score and high train score also a high bias model?

Glorfindel
  • 169
  • 1
  • 5
  • 13
  • 1
    Where did you take these pictures from? Can you also clarify what the _score_ and *fit_times* (on the y-axis) are? I assume that the "cross-validation score" is the model evaluated on separate data. From the plots, it seems that you evaluate and train the data on the same number of samples. Overfitting typically happens when the performance of the model increases on the training data, but the performance decreases on the validation data. Under-fitting occurs when the model does not even perform well on the training data. – nbro Nov 14 '20 at 01:51
  • 1
    See https://en.wikipedia.org/wiki/Overfitting and https://en.wikipedia.org/wiki/Bias%E2%80%93variance_tradeoff. If I interpret correctly your first two plots on the top, the right one should correspond to no _apparent_ over-fitting and underfitting. The left one could indicate that there's some underfitting, because the performance decreases on the training data, even though it increases on the validation data, but you want your model also to perform well on the training data. I don't know how to interpret the other plots because I don't know what the x and y axes are supposed to represent. – nbro Nov 14 '20 at 01:56
  • 1
    Moreover, please, ask only one question per post. Here, you're asking many questions, and it's difficult to address all of them in detail. If you have many questions, ask one for each post. Given that I am not able to properly answer all your question, this really means that your post requires more details and that you should actually split it into multiple posts, one for each distinct question. – nbro Nov 14 '20 at 01:59

0 Answers0