After working 1 year on a project on super resolution, I've learnt the following things about image quality metrics in general:
- There's no such thing as a perfect metric. Every metric suffers from specific downsides and has specific benefits. So you ultimately want to rely on more than one, and check that they all have a consistent (improving) trend.
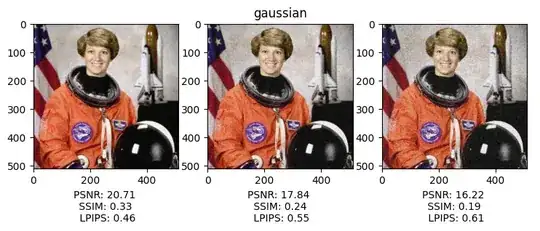
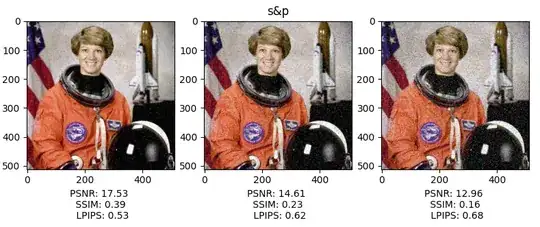
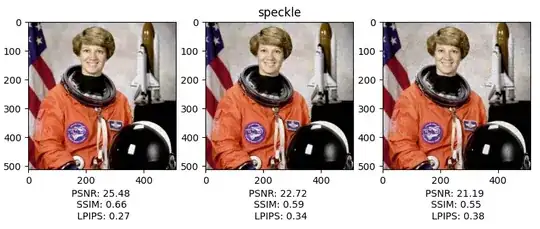
- Every metric is sensitive to different types of noise, and I would argue (no reference to point to unfortunately) even to different image contents. The first point is easily provable with a toy experiment, check images (and code to reproduce them) below. This is a fact you can leverage. For example the LPIPS metric seems to lead to much worse values when gaussian or salt and pepper noise are present compared to speckle noise. So bad lpips value might be a hint that your model is producing those kind of artifacts.
- The PSNR is indeed really unstable. In the images below the image with 3 iterations of speckle noise (bottom right) has a higher psnr than the image with one iteration of gaussian noise (top left), despite looking worse.
My suggestion is to play with the images you're using, add noise, compute metrics and see what happens. It's the only way to gather knowledge about your data, and it makes much more easier to trouble shoot what might be going wrong in your training regime.


Code:
import matplotlib.pyplot as plt
import numpy as np
import skimage.util as sku
from skimage.data import astronaut

import torch
import piq

img = astronaut()
# Normalize image
img = (img - img.min()) / (img.max() - img.min())

modes = ["gaussian", "s&p", "speckle"]

for mode in modes:
    img_noise1 = sku.random_noise(img, mode=mode)
    img_noise2 = sku.random_noise(img_noise1, mode=mode)
    img_noise3 = sku.random_noise(img_noise2, mode=mode)

    tensor = torch.tensor(img).permute(2,0,1).unsqueeze(0)
    tensor_noise1 = torch.tensor(img_noise1).permute(2,0,1).unsqueeze(0)
    tensor_noise2 = torch.tensor(img_noise2).permute(2,0,1).unsqueeze(0)
    tensor_noise3 = torch.tensor(img_noise3).permute(2,0,1).unsqueeze(0)

    psnr1 = piq.psnr(tensor_noise1, tensor).item()
    psnr2 = piq.psnr(tensor_noise2, tensor).item()
    psnr3 = piq.psnr(tensor_noise3, tensor).item()

    ssim1 = piq.ssim(tensor_noise1, tensor).item()
    ssim2 = piq.ssim(tensor_noise2, tensor).item()
    ssim3 = piq.ssim(tensor_noise3, tensor).item()

    lpips = piq.LPIPS()
    lpips1 = lpips(tensor_noise1, tensor).item()
    lpips2 = lpips(tensor_noise2, tensor).item()
    lpips3 = lpips(tensor_noise3, tensor).item()

    fig, (ax1, ax2, ax3) = plt.subplots(1, 3)

    ax1.imshow(img_noise1)
    ax1.set_xlabel(f"PSNR: {psnr1:.2f} \n SSIM: {ssim1:.2f} \n LPIPS: {lpips1:.2f}")
    ax2.imshow(img_noise2)
    ax2.set_xlabel(f"PSNR: {psnr2:.2f} \n SSIM: {ssim2:.2f} \n LPIPS: {lpips2:.2f}")
    ax2.set_title(f"{mode}")
    ax3.imshow(img_noise3)
    ax3.set_xlabel(f"PSNR: {psnr3:.2f} \n SSIM: {ssim3:.2f} \n LPIPS: {lpips3:.2f}")
    plt.show()


