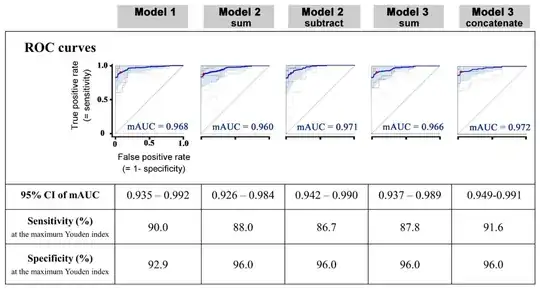
The specificity and sensitivity reported in that table are simply the x and y coordinates of the red dots in the ROC graphs.
And the red dots are instead the points with maximum Youden's index, defined as:
$J = sensitivity + specificity - 1$
So basically J= y-x for each point of the ROC curve. Equivalently, since y=x is the identity line (or chance line when talking about ROC curves), you can define "point with maximum Youden's index" as the point with max height above the identity line.
So to get your specificity and sensitivity as in that table, simply compute the Youden's index for each point, then choose the point with max J and its x and y values will be your specificity and sensitivity.
