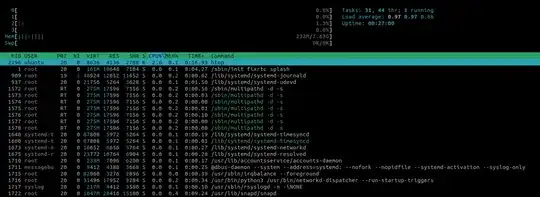
My system, which I freshly installed yesterday has a constant load of about 1 and I don't know why.
I have Ubuntu 21.04 64bit server running on RasPi4 cased in a DeskPi Pro V2. There is a 4TB HDD installed which the system is run from.
Installation on the HardDisk I did based on this tutorial https://jamesachambers.com/raspberry-pi-4-ubuntu-20-04-usb-mass-storage-boot-guide/
I can't find any reason why the load is always about 1.0 and the disk never spins down.
ubuntu@maunakea:~$ top -b -n 1 | head -n 16 top - 05:53:55 up 35 min, 1 user, load average: 0.94, 0.94, 0.92 Tasks: 151 total, 1 running, 150 sleeping, 0 stopped, 0 zombie %Cpu(s): 1.2 us, 5.0 sy, 0.0 ni, 93.8 id, 0.0 wa, 0.0 hi, 0.0 si, 0.0 st MiB Mem : 7808.9 total, 6853.6 free, 284.7 used, 670.6 buff/cache MiB Swap: 0.0 total, 0.0 free, 0.0 used. 7066.6 avail MemPID USER PR NI VIRT RES SHR S %CPU %MEM TIME+ COMMAND4038 ubuntu 20 0 11868 3256 2856 R 17.6 0.0 0:00.06 top 1 root 20 0 170100 12212 6984 S 0.0 0.2 0:43.28 systemd 2 root 20 0 0 0 0 S 0.0 0.0 0:00.02 kthreadd 3 root 0 -20 0 0 0 I 0.0 0.0 0:00.00 rcu_gp 4 root 0 -20 0 0 0 I 0.0 0.0 0:00.00 rcu_par_gp 6 root 0 -20 0 0 0 I 0.0 0.0 0:00.00 kworker/0:0H-events_highpri 8 root 0 -20 0 0 0 I 0.0 0.0 0:00.00 mm_percpu_wq 9 root 20 0 0 0 0 S 0.0 0.0 0:00.00 rcu_tasks_kthre 10 root 20 0 0 0 0 S 0.0 0.0 0:00.00 rcu_tasks_rude_ ubuntu@maunakea:~$ sudo iotop -b |head -n 12 Total DISK READ: 0.00 B/s | Total DISK WRITE: 0.00 B/s Current DISK READ: 0.00 B/s | Current DISK WRITE: 0.00 B/s TID PRIO USER DISK READ DISK WRITE SWAPIN IO COMMAND 1 ?sys root 0.00 B/s 0.00 B/s 0.00 % 0.00 % init fixrtc splash 2 ?sys root 0.00 B/s 0.00 B/s 0.00 % 0.00 % [kthreadd] 3 ?sys root 0.00 B/s 0.00 B/s 0.00 % 0.00 % [rcu_gp] 4 ?sys root 0.00 B/s 0.00 B/s 0.00 % 0.00 % [rcu_par_gp] 6 ?sys root 0.00 B/s 0.00 B/s 0.00 % 0.00 % [kworker/0:0H-events_highpri] 8 ?sys root 0.00 B/s 0.00 B/s 0.00 % 0.00 % [mm_percpu_wq] 9 ?sys root 0.00 B/s 0.00 B/s 0.00 % 0.00 % [rcu_tasks_kthre] 10 ?sys root 0.00 B/s 0.00 B/s 0.00 % 0.00 % [rcu_tasks_rude_] 11 ?sys root 0.00 B/s 0.00 B/s 0.00 % 0.00 % [rcu_tasks_trace]
Remark: The high CPU percentage reported for top is a bit misleading due to batch mode used here for top. In interactive mode it quickly settles down but to ~ 1% but system Load stays high.
What can I else do to track down which process is creating the load?
Also based on htop I can't see why the system should have a load of 1 (sorry I don't know how to get a text output from htop...)
Thanks for all your comments. In the end Nate gave me the right hint.
It seems only to happen when the system is booted without SD card. Having a Ubuntu SD card inserted the OS also is loaded from HDD and the system load is as expected!

topitself that generates the load. It uses 17% in your example. Please try to run top without options and without piping it to head, then you will see live what processes the uses resources over time. – Soren A Sep 24 '21 at 10:20htopand see what it reports. – Artur Meinild Sep 24 '21 at 10:40Result of htop i added above now.
Sorry this is the first time I post a question here so I hope I use the platform as intend….
– DaWastl Sep 24 '21 at 11:40