I am using Ubuntu 20.04 LTS. It used to be fine before I started installing tools like elastic search and other stuff, but now I notice unusually high RAM consumption.
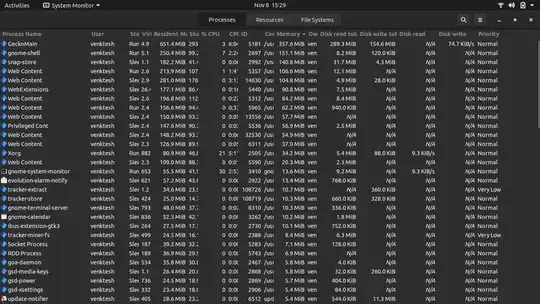
Here are screenshots of my System Monitor:
Here is the output of cat /proc/meminfo:
MemTotal:       16129344 kB
MemFree:         2286680 kB
MemAvailable:    3967360 kB
Buffers:          119744 kB
Cached:          2719044 kB
SwapCached:            0 kB
Active:           610276 kB
Inactive:       11923068 kB
Active(anon):       8048 kB
Inactive(anon): 10646840 kB
Active(file):     602228 kB
Inactive(file):  1276228 kB
Unevictable:      913328 kB
Mlocked:               0 kB
SwapTotal:       2097148 kB
SwapFree:        2097148 kB
Dirty:               160 kB
Writeback:             0 kB
AnonPages:      10608000 kB
Mapped:           600224 kB
Shmem:            960324 kB
KReclaimable:     121880 kB
Slab:             236708 kB
SReclaimable:     121880 kB
SUnreclaim:       114828 kB
KernelStack:       18128 kB
PageTables:        49624 kB
NFS_Unstable:          0 kB
Bounce:                0 kB
WritebackTmp:          0 kB
CommitLimit:    10161820 kB
Committed_AS:   16875648 kB
VmallocTotal:   34359738367 kB
VmallocUsed:       43976 kB
VmallocChunk:          0 kB
Percpu:             6816 kB
HardwareCorrupted:     0 kB
AnonHugePages:         0 kB
ShmemHugePages:        0 kB
ShmemPmdMapped:        0 kB
FileHugePages:         0 kB
FilePmdMapped:         0 kB
HugePages_Total:       0
HugePages_Free:        0
HugePages_Rsvd:        0
HugePages_Surp:        0
Hugepagesize:       2048 kB
Hugetlb:               0 kB
DirectMap4k:      283816 kB
DirectMap2M:     6789120 kB
DirectMap1G:    10485760 kB


ps aux | (read h; echo "$h"; sort -nr -k 4) | head -11 | less -X -S -E– Artur Meinild Nov 08 '21 at 13:21htopto get a more realistic view of memory usage.htopcolor codes memory usage, so the green portion is "used", blue is "buffers" and yellow is "cache" (which is of course volatile, and will be given up when needed). – Artur Meinild Nov 08 '21 at 14:23