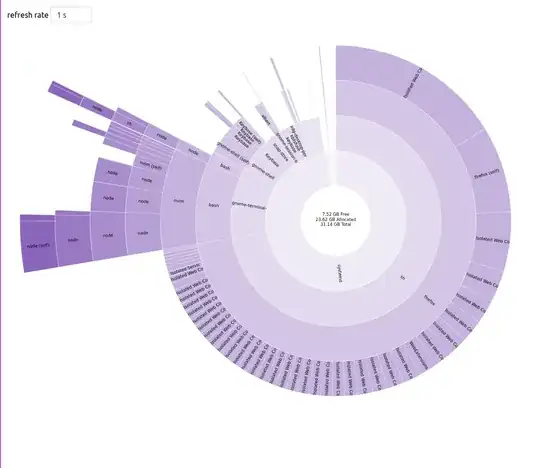
baobab / "Gnome Disk Usage Analyzer" is my favorite way to visualize disk usage -- I'm not sure what the type of graph this is, but it makes sense to me -- diving deep into folders gets more detailed breakdown of the main "slice".
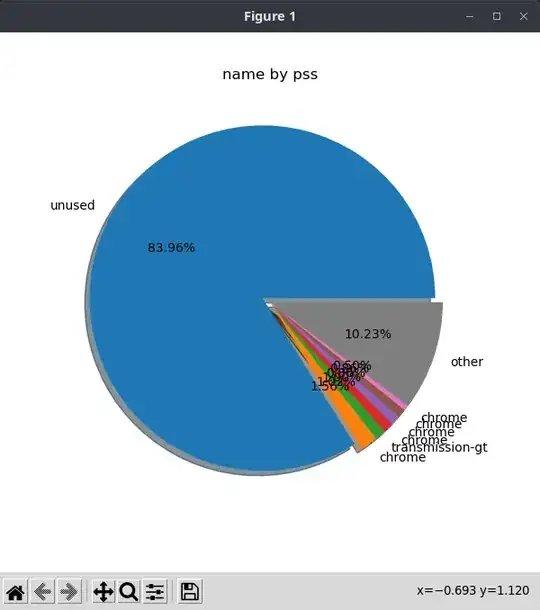
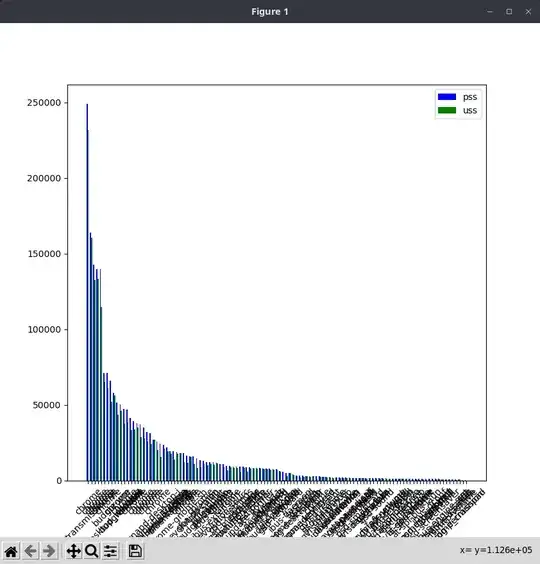
Memory in the "Activity Monitor" or htop, or any other tools I've known, is exceptionally hard to figure out how memory is being used -- because so many programs spawn sub-processes, threads, etc -- it kinda makes sense that a baobab-style graph for memory would bring sense to the madness that is memory usage representation.
Does anything like this exist?
Update!
I learned that the chart is roguhly a "Sunburst Chart". Example: https://observablehq.com/@d3/sunburst
After seeing smem (and all the dependencies needed to install it), I'm considering making what I want .
If one doesn't exist, it doesn't seem too hard -- at least for the jank way I was thinking of implementing it, which is:
- already have Node of some kind on your machine (I'm a JS dev, so I already have node)
- boot up a light-weight server in node with a http server and websocket endpoint for live data
- serve some pre-built static assets to a web browser to render the sunburst chart.
Update 2
Update 3
Progress -- I dropped support for windows and mac so I could get a 1s refresh rate (I could probably do faster, but why bother?)


pnpx ram-usage-analyzer(provided you have node 16 + pnpm installed), It's super early tho -- buggy not performant (yet), no config (yet), awkward ux (for now!) -- kinda getting my bearings around d3 atm.I'm also debating dropping support for windows and macos, so I can just read from /proc directly (for perf reasons)
– NullVoxPopuli Sep 14 '22 at 20:03