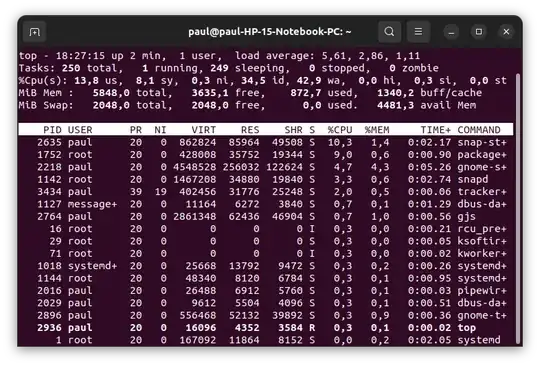
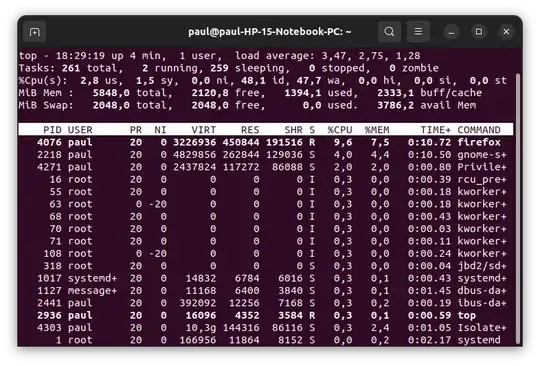
A good starting point is to monitor what the system is doing while it's slow. For example, is the problem due to high CPU load, slow disk access, other unexpected processes, etc.
Try running 'top' from a Term window. This will show the "top" processes (those taking up the most CPU) along with various system statistics. For example :
top - 15:42:30 up 8 min,  1 user,  load average: 2.53, 2.47, 1.48
Tasks: 371 total,   3 running, 367 sleeping,   0 stopped,   1 zombie
%Cpu(s):  1.6 us,  0.8 sy, 16.5 ni, 79.2 id,  0.2 wa,  0.0 hi,  1.8 si,  0.0 st
MiB Mem :  63634.2 total,  50837.3 free,   8354.5 used,   4442.5 buff/cache
MiB Swap:  15625.0 total,  15625.0 free,      0.0 used.  54229.4 avail Mem
PID USER      PR  NI    VIRT    RES    SHR S  %CPU  %MEM     TIME+ COMMAND

4845 boinc     39  19   78420  37620   2048 R  99.3   0.1   7:58.23 wcgrid_+
   4846 boinc     39  19   78260  37564   2048 R  99.3   0.1   7:58.26 wcgrid_+
   2180 rich      20   0 5358744 565044 394320 S  13.3   0.9   0:27.14 gnome-s+
   2987 rich      20   0   12.3g   1.0g 487620 S   6.0   1.6   2:04.64 firefox

   4366 rich      20   0 2857076 276612 115116 S   5.0   0.4   0:33.28 Isolate+
   3410 rich      20   0 2687148 235732 108324 S   2.3   0.4   0:18.82 Isolate+
   2649 rich      20   0   25008  14720   7040 S   1.7   0.0   0:08.54 python3

   3362 rich      20   0   10.7g 297136  95552 S   1.7   0.5   0:08.85 WebExte+
   1170 root      20   0  263824  19328  16512 S   1.3   0.0   0:05.81 openrgb

   6165 rich      20   0  274116  98404  52096 S   1.3   0.2   0:07.33 MainThr+
   2009 rich       9 -11 1910216  31944  22600 S   1.0   0.0   0:03.63 pulseau+
The "load average" effectively shows "how many CPUs are fully busy" with the 3 values showing over the 'short-term', 'medium-term' and 'long-term'.
The Cpu(s) line shows what the current workload is. High 'us' is "usertime" - ie, your processes. High 'sy' is "systemtime" (the operating system). 'id' is the idle time (how much the spare CPU capacity is and 'wa' is "waiting for I/O".
If you have high "wa" then it's likely that you either have a slow disk (consider replacing it with an SSD) or you have some process that's doing lots of disk activity.
There are a lot of other features in 'top' to allow you to drill into different aspects. Press 'h' for help. Press 'q' to quit.
Find the things that are taking up most of the time and this might give you some clues as to what you can tweak or improve to give you better performance.
For a Linux system that you're just using for web browsing I'd say a 10-year-old 6Gb-memory quad-core system should be fine (much less overhead from the O/S than your typical Windows installation!).
EDIT : You have high "waiting for IO" and this could either be a symptom of a problem with your disk (eg, bad sectors) causing each disk access to be slow (eg, due to repeated retries) or could be due to processes performing lots of disk operations.
For the disk operations, run 'sudo iotop'. This is similar to the 'top' command but concentrates on the Input/Output operations rather than processes. Hit 'a' to show 'accumulated' operations if that helps (rather than it refreshing each second). If this shows a particular process that you aren't expecting to performing lots of operations then that could be a likely issue.
If the issue is a problem with the drive itself then you might see some messages in /var/log/syslog. To see this try 'sudo tail -1000 /var/log/syslog|more' and page through, looking for messages that indicate a problem with reads/writes on the device (eg, /dev/sda1, etc.).
I don't have enough reputation to comment but I wouldn't try defragging the ext4 partition. Ext4 is pretty good at keeping itself efficient and since it's a fresh install there will be very little fragmentation. However, if there is a disk problem the defragging is likely to cause more issues (since it will be attempting to move sectors to/from bad sectors). In my experience, you generally never need to defrag ext4.
Also, buff/cache isn't a problem and just shows the amount of memory that is used to store data that has previously been read from (or written to) disk. As you aren't using any swap space there is no problem with buffers or cache and it's doing just what it's supposed to (storing things in memory in case they're needed again). Generally you want as much as possible buffered/cached as that means the system doesn't need to access the disk.
Another thing worth looking at (if you have multiple disk devices) is 'sar -d 5'. This will output the disk access statistics every 5 seconds (change the interval if you need to), showing which devices are actually being accessed. If, for example, you're seeing activity on a slow USB drive it could point to a cause.


free -hwhen your system is running fast. Run it again when your system is running slow. Add both sets of output to your question above. – user535733 Feb 11 '24 at 13:02e4defragon my ~ home directory and got the "does not need defragmentation" message. I guess you mean I should do it on/maybe? – minisaurus Feb 11 '24 at 19:26/to see if that fixes boot and login lag, as those will read a lot of files from/usr. If your home directory doesn't need it, then I don't know how to improve Firefox startup lag except deleting history. – Daniel T Feb 11 '24 at 20:30