25

I can see in my System Monitor that data is being uploaded and downloaded, I can see in Etherape which sites it's connecting to and which protocol is being used. However without looking at the actual packets in WireShark and then finding the port and which process is listening on that port I am unable to tell which processes are uploading and downloading data. So I was wondering if there is an easier way that using WireShark (or some other tool) to find the port manually and then see which process is listening on that port? This application would ideally:

  • Give me a list of processes
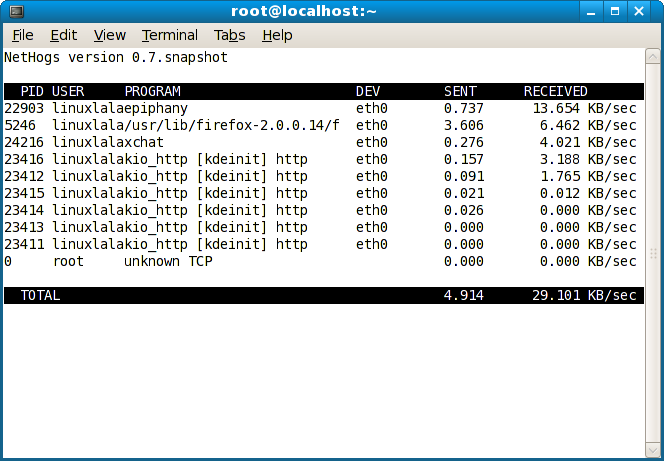
  • Show me (in KiB/s) the amount of data being uploaded and downloaded (in different columns)
  • Show me the PIDs of the processes
  • Show me the ports which the processes are listening on
  • Show me all this information in a table
  • Be a CLI program (ideally, but it doesn't have to be in the CLI)
  • Have the ability to change the update interval of the data

I am running Ubuntu GNOME 15.10 with GNOME 3.18, is there such a software that would meet my needs?

  • 1
    Why the downvote? – s3lph Dec 07 '15 at 11:38
  • 4
    Not me, but honestly these are quite a bit of requirements. – kos Dec 07 '15 at 11:55
  • @ParanoidPanda My bad. I meant to suggest iftop not iotop. – kasperd Dec 08 '15 at 12:07
  • @kasperd: Does it match all of my requirements? Because from its description it does not appear to say that it will show processes... –  Dec 08 '15 at 12:10
  • @ParanoidPanda Looks like it can only display port numbers. I don't think there exist any reliable method to decide which process produced the traffic. There are heuristics to figure out which process is using which port, but they won't always produce correct results, and it doesn't look like iftop has implemented any such heuristics. – kasperd Dec 08 '15 at 12:35

1 Answers1

42

I think the program Nethogs perfectly suits your requirements. From the description:

NetHogs is a small 'net top' tool. Instead of breaking the traffic down per protocol or per subnet, like most tools do, it groups bandwidth by process.

You can find this tool in the package nethogs, so install it with

sudo apt-get install nethogs

The tool is started with the following command:

sudo nethogs <if>
# e.g. sudo nethogs eth0

The output looks like this:

You can cycle through various display modes with M; this will toggle between different measurement units and bandwidth usage vs. data amount.

The update interval can be set with the -d option, as described in the manpage nethogs(8).

Elder Geek
  • 36,023
  • 25
  • 98
  • 183
s3lph
  • 14,314
  • 11
  • 59
  • 82