| |||||||||||||||||||||||||||||||||||||
11 of the 33 seats to City of Lincoln Council 17 seats needed for a majority | |||||||||||||||||||||||||||||||||||||
|---|---|---|---|---|---|---|---|---|---|---|---|---|---|---|---|---|---|---|---|---|---|---|---|---|---|---|---|---|---|---|---|---|---|---|---|---|---|
| |||||||||||||||||||||||||||||||||||||
 Map showing the results the 1980 Lincoln City Council elections by ward. Red shows Labour seats and blue shows the Conservatives seats. | |||||||||||||||||||||||||||||||||||||
| |||||||||||||||||||||||||||||||||||||
The 1980 City of Lincoln Council election took place on 1 May 1980. This was on the same day as other local elections. One third of the council was up for election: the seats of the candidates who polled third at the all out election of 1979. The Conservative Party retained control of the council.
Overall results
| Party | Seats | Gains | Losses | Net gain/loss | Seats % | Votes % | Votes | +/− | |
|---|---|---|---|---|---|---|---|---|---|
| Labour | 4 | 6 | 0 | 63.6 | 43.3 | 9,986 | |||
| Conservative | 7 | 0 | 4 | 36.4 | 37.9 | 8,758 | |||
| Democratic Labour | 0 | 0 | 2 | 0.0 | 8.0 | 1,842 | |||
| Liberal | 0 | 0 | 0 | 0.0 | 10.4 | 2,399 | |||
| Ecology | 0 | 0 | 0 | 0.0 | 0.4 | 96 | |||
| Total | 11 | 23,081 | |||||||
Ward results
Abbey

Location of Abbey ward
| Party | Candidate | Votes | % | |
|---|---|---|---|---|
| Labour | J. Robertson | 1,066 | 50.8% | |
| Conservative | J. Frost | 567 | 27.0% | |
| Democratic Labour | C. Sanderson | 235 | 11.2% | |
| Liberal | Feeney | 232 | 11.0% | |
| Turnout | 40.1% | |||
| Labour gain from Democratic Labour | ||||
Birchwood

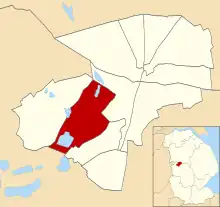
Location of Birchwood ward
| Party | Candidate | Votes | % | |
|---|---|---|---|---|
| Labour | Wright | 823 | 45.4% | |
| Conservative | Colam | 567 | 31.3% | |
| Liberal | Templeman | 424 | 23.4% | |
| Turnout | 46.7% | |||
| Labour gain from Conservative | ||||
Boultham

Location of Boultham ward
| Party | Candidate | Votes | % | |
|---|---|---|---|---|
| Labour | Ralph Toofany[4] | 877 | 41.6% | |
| Conservative | B. Stanton | 698 | 33.1% | |
| Democratic Labour | H. Buttery | 293 | 13.9% | |
| Liberal | Raisen | 187 | 8.9% | |
| Ecology | C. Moulton | 52 | 2.5% | |
| Turnout | 42.9% | |||
| Labour gain from Conservative | ||||
Bracebridge

Location of Bracebridge ward
| Party | Candidate | Votes | % | |
|---|---|---|---|---|
| Conservative | P. Roe | 988 | 46.1% | |
| Labour | S. Close | 876 | 40.9% | |
| Liberal | J. Gill | 280 | 13.1% | |
| Turnout | 40.5% | |||
| Conservative hold | ||||
Carholme

Location of Carholme ward
| Party | Candidate | Votes | % | |
|---|---|---|---|---|
| Conservative | C. Ireland | 1,180 | 51.2% | |
| Democratic Labour | L. Wells | 801 | 34.8% | |
| Labour | D. Smith | 323 | 14.0% | |
| Turnout | 42.1% | |||
| Conservative hold | ||||
Castle

Location of Castle ward
| Party | Candidate | Votes | % | |
|---|---|---|---|---|
| Conservative | D. Chambers | 1,060 | 43.4% | |
| Labour | Townrow | 994 | 40.7% | |
| Liberal | F. Goulding | 272 | 11.1% | |
| Democratic Labour | Barnes | 118 | 4.8% | |
| Turnout | 48.2% | |||
| Conservative hold | ||||
Longdales

Location of Longdales ward
| Party | Candidate | Votes | % | |
|---|---|---|---|---|
| Labour | D. Miller | 934 | 44.1% | |
| Conservative | R. Long | 856 | 40.4% | |
| Liberal | Turver | 216 | 10.2% | |
| Democratic Labour | L. Davis | 113 | 5.3% | |
| Turnout | 42.2% | |||
| Labour gain from Conservative | ||||
Minster

Location of Minster ward
| Party | Candidate | Votes | % | |
|---|---|---|---|---|
| Conservative | F. Horn | 1,220 | 46.9% | |
| Labour | J. Ward | 1,078 | 41.4% | |
| Liberal | Hoyes | 304 | 11.7% | |
| Turnout | 44.1% | |||
| Conservative hold | ||||
Moorland

Location of Moorland ward
| Party | Candidate | Votes | % | |
|---|---|---|---|---|
| Labour | N. Baldock | 921 | 50.7% | |
| Conservative | A. Parker | 897 | 49.3% | |
| Turnout | 37.7% | |||
| Labour gain from Conservative | ||||
Park

Location of Park ward
| Party | Candidate | Votes | % | |
|---|---|---|---|---|
| Labour | J. Plant | 577 | 30.1% | |
| Liberal | P. Taylor | 484 | 25.2% | |
| Democratic Labour | F. Allen | 422 | 22.0% | |
| Conservative | J. Kay | 393 | %20.5 | |
| Ecology | Camidge | 44 | 2.3% | |
| Turnout | 39.4% | |||
| Labour gain from Democratic Labour | ||||
Tritton
Location of Tritton ward
| Party | Candidate | Votes | % | |
|---|---|---|---|---|
| Labour | H. Hubbard | 1,039 | 60.8% | |
| Democratic Labour | Phillips | 338 | 19.8% | |
| Conservative | Burgess | 332 | 19.4% | |
| Turnout | 39.3% | |||
| Labour hold | ||||
References
- ↑ "Council compositions by year". The Elections Centre.
- ↑ "Local Election Summaries 1980". The Elections Centre.
- 1 2 3 4 5 6 7 8 9 10 11 "City of Lincoln Council Election Results 1973-2012". Elections Centre. Retrieved 29 October 2019.
- ↑ "Councillors - Boultham ward". Archived from the original on 19 April 2003. Retrieved 4 November 2019.
| Lincolnshire County Council | |||||||||||||||||||||
|---|---|---|---|---|---|---|---|---|---|---|---|---|---|---|---|---|---|---|---|---|---|
| Boston Borough Council | |||||||||||||||||||||
| East Lindsey District Council | |||||||||||||||||||||
| City of Lincoln Council | |||||||||||||||||||||
| North East Lincolnshire Council | |||||||||||||||||||||
| North Kesteven District Council | |||||||||||||||||||||
| North Lincolnshire Council | |||||||||||||||||||||
| South Holland District Council | |||||||||||||||||||||
| South Kesteven District Council | |||||||||||||||||||||
| West Lindsey District Council | |||||||||||||||||||||
| |||||||||||||||||||||
| |||||||||||||||||||||
| Metropolitan boroughs |
|
|---|---|
| District councils (England) |
|
| District councils (Scotland) |
|
This article is issued from Wikipedia. The text is licensed under Creative Commons - Attribution - Sharealike. Additional terms may apply for the media files.