Nottinghamshire County Council elections are held every four years. Nottinghamshire County Council is the upper-tier authority for the non-metropolitan county of Nottinghamshire in England. Since the last boundary changes in 2017, 66 county councillors have been elected from 56 electoral divisions.[1]
Council elections
- 1973 Nottinghamshire County Council election
- 1977 Nottinghamshire County Council election
- 1981 Nottinghamshire County Council election
- 1985 Nottinghamshire County Council election
- 1989 Nottinghamshire County Council election
- 1993 Nottinghamshire County Council election
- 1997 Nottinghamshire County Council election
- 2001 Nottinghamshire County Council election
- 2005 Nottinghamshire County Council election (boundary changes increased the number of seats by 4)[2]
- 2009 Nottinghamshire County Council election
- 2013 Nottinghamshire County Council election
- 2017 Nottinghamshire County Council election
- 2021 Nottinghamshire County Council election
County result maps
 2021 results map
 2017 results map
 2013 results map
 2009 results map
 2005 results map
 2001 results map
 1997 results map
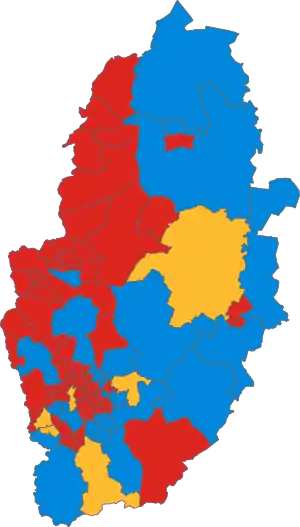 1993 results map
 1989 results map
 1985 results map
 1981 results map
By-election results
1997-2001
| Party | Candidate | Votes | % | ±% | |
|---|---|---|---|---|---|
| Conservative | 835 | 61.6 | +20.1 | ||
| Labour | 457 | 33.7 | -16.1 | ||
| Liberal Democrats | 64 | 4.7 | -4.0 | ||
| Majority | 378 | 27.9 | |||
| Turnout | 1,356 | ||||
| Conservative gain from Labour | Swing | ||||
| Party | Candidate | Votes | % | ±% | |
|---|---|---|---|---|---|
| Labour | 746 | 71.3 | |||
| Conservative | 301 | 28.7 | |||
| Majority | 445 | 42.6 | |||
| Turnout | 1,047 | 14.8 | |||
| Labour hold | Swing | ||||
2001-2005
| Party | Candidate | Votes | % | ±% | |
|---|---|---|---|---|---|
| Conservative | 1,895 | 65.2 | +17.3 | ||
| Liberal Democrats | 813 | 28.0 | +0.6 | ||
| Labour | 197 | 6.8 | +0.0 | ||
| Majority | 1,082 | 37.2 | |||
| Turnout | 2,905 | 25.1 | |||
| Conservative hold | Swing | ||||
| Party | Candidate | Votes | % | ±% | |
|---|---|---|---|---|---|
| Conservative | Richard Jackson | 1,488 | 46.5 | +9.1 | |
| Labour | 1,163 | 36.3 | -6.5 | ||
| Liberal Democrats | 552 | 17.2 | +2.2 | ||
| Majority | 325 | 10.2 | |||
| Turnout | 3,203 | 35.8 | |||
| Conservative gain from Labour | Swing | ||||
2005-2009
| Party | Candidate | Votes | % | ±% | |
|---|---|---|---|---|---|
| Labour | Helen Holt | 1,228 | 38.0 | +3.5 | |
| Conservative | Ken Rees | 628 | 19.4 | +1.0 | |
| Independent | Syd Owen | 620 | 19.2 | +2.0 | |
| Liberal Democrats | Phillip Smith | 544 | 16.8 | -0.3 | |
| Green | Paul Frost | 214 | 6.6 | -2.2 | |
| Majority | 600 | 18.6 | |||
| Turnout | 3,234 | 17.5 | |||
| Labour hold | Swing | ||||
| Party | Candidate | Votes | % | ±% | |
|---|---|---|---|---|---|
| Conservative | Michael Murphy | 1,597 | 32.5 | +0.3 | |
| Labour | John Wilmott | 1,554 | 31.6 | -18.2 | |
| Liberal Democrats | Harry Toseland | 1,007 | 20.5 | +20.5 | |
| UKIP | Peter Foulkes | 413 | 8.4 | +8.4 | |
| Green | Mark Harrison | 350 | 7.1 | -4.5 | |
| Majority | 43 | 0.9 | |||
| Turnout | 4,921 | 21.2 | |||
| Conservative gain from Labour | Swing | ||||
| Party | Candidate | Votes | % | ±% | |
|---|---|---|---|---|---|
| Liberal Democrats | Jason Zadrozny | 1,979 | 73.1 | +59.2 | |
| Labour | David Parker | 435 | 16.1 | -28.7 | |
| Conservative | Peter Thorpe | 222 | 8.2 | -15.6 | |
| UKIP | Peter Foulkes | 70 | 2.6 | +2.6 | |
| Majority | 1,544 | 57.0 | |||
| Turnout | 2,706 | 31.6 | |||
| Liberal Democrats gain from Labour | Swing | ||||
| Party | Candidate | Votes | % | ±% | |
|---|---|---|---|---|---|
| Conservative | Stuart Wallace | 517 | 45.2 | -6.4 | |
| Liberal Democrats | Chris Harrison | 322 | 28.1 | -2.3 | |
| Labour | Glenn Bardill | 198 | 17.3 | -0.7 | |
| UKIP | Terry Coleman | 107 | 9.4 | +9.4 | |
| Majority | 195 | 17.1 | |||
| Turnout | 1,144 | 15.6 | |||
| Conservative hold | Swing | ||||
| Party | Candidate | Votes | % | ±% | |
|---|---|---|---|---|---|
| Labour | Chris Winterton | 1,342 | 33.5 | +13.4 | |
| Mansfield Independent Forum | Andrew Tristram | 1,108 | 27.6 | -12.7 | |
| Conservative | Drew Stafford | 774 | 19.3 | -9.2 | |
| UKIP | Nick Bennet | 489 | 12.2 | +12.2 | |
| Liberal Democrats | Danielle Gent | 295 | 7.4 | -3.8 | |
| Majority | 234 | 5.9 | |||
| Turnout | 4,008 | 20.9 | |||
| Labour gain from Independent | Swing | ||||
2009-2013
| Party | Candidate | Votes | % | ±% | |
|---|---|---|---|---|---|
| Conservative | John Doddy | 1,958 | 47.7 | +5.9 | |
| Liberal Democrats | David Watts | 1,375 | 33.5 | +20.6 | |
| UKIP | Lee Waters | 682 | 16.6 | +7.0 | |
| Majority | 583 | 14.2 | |||
| Turnout | 4,102 | 25.6 | |||
| Conservative hold | Swing | ||||
| Party | Candidate | Votes | % | ±% | |
|---|---|---|---|---|---|
| Labour | John Peck | 1,557 | 58.0 | +27.8 | |
| Conservative | Daniel Mottishaw | 660 | 24.6 | -9.7 | |
| Nottinghamshire Independents | Jim Gregson | 346 | 12.9 | -22.7 | |
| UKIP | Carole Terzza | 123 | 4.6 | +4.6 | |
| Majority | 897 | 33.4 | |||
| Turnout | 2,686 | 24.52 | |||
| Labour gain from Nottinghamshire Independents | Swing | ||||
2013-2017
| Party | Candidate | Votes | % | ±% | |
|---|---|---|---|---|---|
| Conservative | Francis Purdue-Horan | 1,270 | 44.0 | +2.2 | |
| Independent | Tracey Kerry | 1,232 | 42.7 | N/A | |
| Labour | Alan Walker | 382 | 13.2 | -7.0 | |
| Majority | 38 | 1.3 | |||
| Turnout | 2,890 | 28.1 | |||
| Conservative hold | Swing | ||||
2021-2025
| Party | Candidate | Votes | % | ±% | |
|---|---|---|---|---|---|
| Independent | Debbie Darby | 2,009 | 63.8 | +63.8 | |
| Conservative | Jack Kellas | 898 | 28.5 | -11.7 | |
| Labour | Jennifer Kaye | 244 | 7.7 | +7.7 | |
| Majority | 1,111 | 35.3 | |||
| Turnout | 2,890 | ||||
| Independent hold | Swing | ||||
| Party | Candidate | Votes | % | ±% | |
|---|---|---|---|---|---|
| Independent | Kane Oliver | 1,223 | 43.1 | +43.1 | |
| Labour | Milan Radulovic | 1,182 | 41.7 | -0.1 | |
| Conservative | Mick Brown | 431 | 15.2 | -31.2 | |
| Majority | 41 | 1.4 | |||
| Turnout | 2,836 | ||||
| Independent gain from Conservative | Swing | ||||
| Party | Candidate | Votes | % | ±% | |
|---|---|---|---|---|---|
| Ashfield Ind. | Rachel Madden | 1,680 | 51.2 | -7.0 | |
| Labour | Lorraine Fagan | 1,017 | 31.0 | +8.5 | |
| Conservative | Sam Howlett | 584 | 17.8 | -1.5 | |
| Majority | 663 | 20.2 | |||
| Turnout | 3,281 | ||||
| Ashfield Ind. hold | Swing | ||||
References
- ↑ "The Nottinghamshire (Electoral Changes) Order 2016", legislation.gov.uk, The National Archives, SI 2016/659, retrieved 19 August 2022
- ↑ "Local election results: Nottinghamshire". BBC News Online. Retrieved 25 September 2009.
- ↑ "East Mansfield by-election 2006". Nottinghamshire County Council. Retrieved 25 September 2009.
- ↑ "Hucknall by-election 2007". Nottinghamshire County Council. Retrieved 25 September 2009.
- ↑ "Sutton-in-Ashfield North By-election 2007". Nottinghamshire County Council. Retrieved 25 September 2009.
- ↑ "Newark East by-election result". Nottinghamshire County Council. 18 September 2009. Retrieved 25 September 2009.
- ↑ "Mansfield South by-election result". Nottinghamshire County Council. 26 February 2010. Retrieved 26 February 2010.
- ↑ "DECLARATION OF RESULT OF POLL" (PDF). 4 August 2016. Retrieved 18 August 2023.
- ↑ "Local Elections Archive Project — Collingham Division". www.andrewteale.me.uk. Retrieved 23 May 2022.
- ↑ "Local Elections Archive Project — Eastwood Division". www.andrewteale.me.uk. Retrieved 23 May 2022.
- ↑ "Local Elections Archive Project — Kirkby South Division". www.andrewteale.me.uk. Retrieved 23 May 2022.
External links
This article is issued from Wikipedia. The text is licensed under Creative Commons - Attribution - Sharealike. Additional terms may apply for the media files.