Plymouth City Council is the local authority for the a unitary authority of Plymouth in Devon, England. Until 1 April 1998 it was a non-metropolitan district.
Political control
Since the first election to the council in 1973 following the reforms of the Local Government Act 1972, political control of the council has been held by the following parties:[1][2]
Non-metropolitan district
| Election | Labour | Conservatives | SDP–Liberal Alliance | Independent Conservative | Party in control | |
|---|---|---|---|---|---|---|
| 1973 | 29 | 37 | Conservative | |||
| 1976 | 27 | 39 | ||||
| 1979 | 26 | 33 | 1 | |||
| 1983 | 23 | 34 | 3 | |||
| 1987 | 19 | 31 | 10 | |||
| 1991 | 41 | 19 | Labour | |||
| 1995 | 54 | 6 | ||||
Unitary authority
Election summary
After 2003, the council was elected in thirds. The number of councillors for each party following each election is listed in the table.
| Election | Labour | Conservative | Liberal Democrats | UKIP | Green | Ind. All. | Independent |
|---|---|---|---|---|---|---|---|
| 1997 | 47 | 13 | |||||
| 2000 | 22 | 38 | |||||
| 2003 | 36 | 18 | 3 | ||||
| 2004 | 35 | 19 | 2 | ||||
| 2006 | 28 | 25 | 3 | 1 | |||
| 2007 | 26 | 31 | |||||
| 2008 | 20 | 37 | |||||
| 2010 | 20 | 36 | 1 | ||||
| 2011 | 25 | 31 | 1 | ||||
| 2012 | 31 | 26 | |||||
| 2014 | 30 | 24 | 3 | ||||
| 2015 | 28 | 26 | 3 | ||||
| 2016 | 27 | 27 | 3 | ||||
| 2018 | 31 | 26 | |||||
| 2019 | 31 | 25 | 1 | ||||
| 2021 | 24 | 26 | 7 | ||||
| 2022 | 24 | 24 | 1 | 8 | |||
| 2023 | 31 | 18 | 2 | 3 | 2 |
Council elections
Non-metropolitan district elections
- 1973 Plymouth City Council election
- 1976 Plymouth City Council election
- 1979 Plymouth City Council election (New ward boundaries)[3]
- 1983 Plymouth City Council election
- 1987 Plymouth City Council election (City boundary changes took place but the number of seats remained the same)[4]
- 1991 Plymouth City Council election
- 1995 Plymouth City Council election
Unitary authority elections
- 1997 Plymouth City Council election
- 2000 Plymouth City Council election
- 2003 Plymouth City Council election (New ward boundaries reduced the number of seats by 3)[5][6][7]
- 2004 Plymouth City Council election
- 2006 Plymouth City Council election
- 2007 Plymouth City Council election
- 2008 Plymouth City Council election
- 2010 Plymouth City Council election
- 2011 Plymouth City Council election
- 2012 Plymouth City Council election
- 2014 Plymouth City Council election
- 2015 Plymouth City Council election
- 2016 Plymouth City Council election[8][9]
- 2018 Plymouth City Council election
- 2019 Plymouth City Council election
- 2021 Plymouth City Council election
- 2022 Plymouth City Council election
- 2023 Plymouth City Council election
Result maps
 1979 results map
 1983 results map
 1987 results map
 1991 results map
 1995 results map
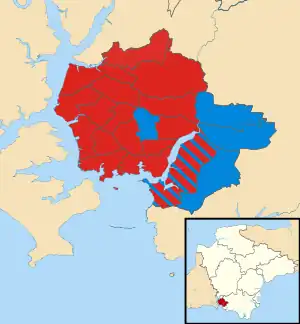 1997 results map
 2000 results map
 2003 results map
 2004 results map
 2006 results map
 2007 results map
 2008 results map
 2010 results map
 2011 results map
 2012 results map
 2014 results map
 2015 results map
 2016 results map
 2018 results map
 2019 results map
 2021 results map
 2022 results map
 2023 results map
By-elections
1997-2000
| Party | Candidate | Votes | % | ±% | |
|---|---|---|---|---|---|
| Labour | 1,328 | 61.1 | -11.3 | ||
| Conservative | 420 | 19.3 | -8.3 | ||
| Liberal Democrats | 344 | 15.8 | +15.8 | ||
| Independent | 67 | 3.1 | +3.1 | ||
| Independent Democrat | 14 | 0.6 | +0.6 | ||
| Majority | 908 | 41.8 | |||
| Turnout | 2,173 | 23.0 | |||
| Labour hold | Swing | ||||
| Party | Candidate | Votes | % | ±% | |
|---|---|---|---|---|---|
| Labour | 1,017 | 65.5 | +4.8 | ||
| Conservative | 307 | 19.8 | -2.3 | ||
| Liberal Democrats | 173 | 11.1 | +11.1 | ||
| Independent Democrat | 56 | 3.6 | -13.6 | ||
| Majority | 710 | 45.7 | |||
| Turnout | 1,553 | ||||
| Labour hold | Swing | ||||
2000-2003
| Party | Candidate | Votes | % | ±% | |
|---|---|---|---|---|---|
| Labour | 1,179 | ||||
| Labour | 1,101 | ||||
| Liberal Democrats | 590 | ||||
| Liberal Democrats | 566 | ||||
| Conservative | 464 | ||||
| Conservative | 449 | ||||
| Green | 120 | ||||
| Green | 119 | ||||
| UKIP | 51 | ||||
| Turnout | 4,639 | 29.9 | |||
| Labour hold | Swing | ||||
| Labour gain from Conservative | Swing | ||||
| Party | Candidate | Votes | % | ±% | |
|---|---|---|---|---|---|
| Labour | 1,253 | 55.7 | +8.9 | ||
| Conservative | 715 | 31.8 | -6.7 | ||
| Liberal Democrats | 282 | 12.5 | +0.0 | ||
| Majority | 538 | 23.9 | |||
| Turnout | 2,250 | 25.5 | |||
| Labour hold | Swing | ||||
2003-2006
| Party | Candidate | Votes | % | ±% | |
|---|---|---|---|---|---|
| Labour | James Kirk | 1,624 | 43.3 | +3.9 | |
| Conservative | Brenda Brookshaw | 1,517 | 40.5 | +0.3 | |
| Liberal Democrats | Terrance O'Connor | 214 | 5.7 | -14.7 | |
| BNP | Liam Birch | 200 | 5.3 | +5.3 | |
| UKIP | Thomas Williams | 139 | 3.7 | +3.7 | |
| Green | Raymond Tuohy | 53 | 1.4 | +1.4 | |
| Majority | 107 | 2.8 | |||
| Turnout | 3,747 | 40.4 | |||
| Labour hold | Swing | ||||
2006-2010
| Party | Candidate | Votes | % | ±% | |
|---|---|---|---|---|---|
| Labour | Tina Tuohy | 1,243 | 44.0 | +2.7 | |
| Conservative | Nigel Churchill | 676 | 23.9 | -15.7 | |
| UKIP | Andrew Leigh | 442 | 15.6 | +15.6 | |
| Independent | Margaret Storer | 204 | 7.2 | +7.2 | |
| Liberal Democrats | Rebecca Trimnell | 181 | 6.4 | -6.8 | |
| BNP | Adrian Romilly | 82 | 2.9 | +2.9 | |
| Majority | 567 | 20.1 | |||
| Turnout | 2,828 | 29.0 | |||
| Labour hold | Swing | ||||
2010-2014
| Party | Candidate | Votes | % | ±% | |
|---|---|---|---|---|---|
| Labour | Jonny Morris | 1,247 | 43.1 | -8.2 | |
| UKIP | Peter David Berrow | 764 | 26.4 | +4.6 | |
| Conservative | David Alexander Downie | 487 | 16.8 | -10.0 | |
| Independent | Dennis Law Silverwood | 290 | 10.0 | +10.0 | |
| Liberal Democrats | Justin Dominic Stafford | 82 | 2.8 | +2.8 | |
| TUSC | Ryan Aldred | 22 | 22 0.8 | +0.8 | |
| Majority | 483 | ||||
| Turnout | 29.24 | ||||
| Labour hold | Swing | ||||
2018-2022
| Party | Candidate | Votes | % | ±% | |
|---|---|---|---|---|---|
| Labour | Jemima Laing | 1,427 | 52.8% | +0.2% | |
| Conservative | Kathy Watkin | 981 | 36.3% | +2.8% | |
| Liberal Democrats | Connor Clarke | 174 | 6.4% | +1.4% | |
| Active for Plymouth | Iuliu Popescue | 123 | 4.5% | +4.5% | |
| Majority | |||||
| Turnout | |||||
| Labour hold | Swing | ||||
2022-2026
| Party | Candidate | Votes | % | ±% | |
|---|---|---|---|---|---|
| Labour | Will Noble | 1,415 | 53.2 | +16.7 | |
| Conservative | Andrea Johnson | 877 | 33.0 | -21.0 | |
| Independent | Gavin Marshall | 184 | 6.9 | +6.9 | |
| Green | Frank Hartkopf | 87 | 3.3 | -0.7 | |
| Liberal Democrats | Colin Mackenzie | 77 | 2.9 | -1.5 | |
| TUSC | Andrew White | 18 | 0.7 | -0.4 | |
| Majority | 538 | 20.2 | |||
| Turnout | 2,658 | ||||
| Labour gain from Conservative | Swing | ||||
| Party | Candidate | Votes | % | ±% | |
|---|---|---|---|---|---|
| Green | Lauren McLay | 653 | 44.9 | -12.8 | |
| Conservative | Ashley Ward | 425 | 29.2 | -5.7 | |
| Independent | Andrew Hill | 182 | 12.5 | +12.5 | |
| Labour | Lindsay Gilmour | 147 | 10.1 | +2.7 | |
| Liberal Democrats | Mike Gillbard | 33 | 2.3 | +2.3 | |
| TUSC | Benjamin Davy | 15 | 1.0 | +1.0 | |
| Majority | 228 | 15.7 | |||
| Turnout | 1,455 | ||||
| Green gain from Conservative | Swing | ||||
| Party | Candidate | Votes | % | ±% | |
|---|---|---|---|---|---|
| Labour | Paul McNamara | 1,204 | 58.8 | -0.1 | |
| Conservative | Will Jones | 423 | 20.6 | -1.0 | |
| Green | Pat Bushell | 196 | 9.6 | -2.1 | |
| Liberal Democrats | Alexander Primmer | 80 | 3.9 | -1.5 | |
| Independent | Chaz Singh | 69 | 3.4 | +3.4 | |
| Heritage | Darryl Ingram | 54 | 2.6 | +2.6 | |
| TUSC | Neil Prentice | 23 | 1.1 | -1.3 | |
| Majority | 781 | 38.1 | |||
| Turnout | 2,049 | ||||
| Labour hold | Swing | ||||
| Party | Candidate | Votes | % | ±% | |
|---|---|---|---|---|---|
| Labour | Stefan Krizanac | 1,072 | 33.2 | -17.5 | |
| Conservative | Julie Hunt | 919 | 28.4 | -1.7 | |
| Liberal Democrats | Peter Edwards | 596 | 18.4 | +13.6 | |
| Independent | Grace Stickland | 480 | 14.9 | +14.9 | |
| Green | Bruce Robinson | 97 | 3.0 | -0.7 | |
| Heritage | Darryl Ingram | 55 | 1.7 | +1.3 | |
| TUSC | Jackie Hilton | 12 | 0.4 | -0.1 | |
| Majority | 153 | 4.7 | |||
| Turnout | 3,231 | ||||
| Labour gain from Conservative | Swing | ||||
| Party | Candidate | Votes | % | ±% | |
|---|---|---|---|---|---|
| Labour | Alison Raynsford | 1,126 | 48.0 | +0.0 | |
| Conservative | Ian Fleming | 488 | 20.8 | +2.6 | |
| Green | Shayna Newham-Joynes | 206 | 8.8 | -1.8 | |
| Liberal Democrats | Hugh Janes | 175 | 7.5 | +0.6 | |
| Reform UK | Andy Gibbons | 174 | 7.4 | +3.1 | |
| Independent | Chaz Singh | 126 | 5.4 | +5.4 | |
| TUSC | Ryan Aldred | 52 | 2.2 | -0.8 | |
| Majority | 638 | 27.2 | |||
| Turnout | 2,347 | ||||
| Labour hold | Swing | ||||
References
- ↑ "Council compositions". The Elections Centre. Retrieved 3 May 2016.
- ↑ "Plymouth". BBC News Online. 19 April 2008. Retrieved 22 September 2009.
- ↑ The City of Plymouth (Electoral Arrangements) Order 1978
- ↑ The Devon (District Boundaries) Order 1985
- ↑ legislation.gov.uk - The City of Plymouth (Electoral Changes) Order 2002. Retrieved on 4 October 2015.
- ↑ "Local elections". BBC News Online. Retrieved 22 September 2009.
- ↑ "Council and democracy". Plymouth City Council. Retrieved 22 September 2009.
- ↑ "Labour lose their majority hold over Plymouth City Council". The Herald. 8 May 2015. Archived from the original on 30 September 2015. Retrieved 2 December 2015.
- ↑ "About Plymouth City Council". Plymouth City Council. Retrieved 2 December 2015.
- ↑ "Local Authority Byelecion Results - August 1997". Retrieved 19 November 2019.
- ↑ "Local Authority Byelecion Results - September 1997". Retrieved 19 November 2019.
- ↑ "Local Authority Byelecion Results - May 2002". Retrieved 19 November 2019.
- ↑ "Local Authority Byelecion Results - May 2002". Retrieved 19 November 2019.
- ↑ "Labour regains control of Plymouth city council". guardian.co.uk. London. 23 June 2006. Retrieved 22 September 2009.
- ↑ "Ham by-election". Plymouth City Council. Archived from the original on 9 June 2011. Retrieved 22 September 2009.
- ↑ "Local Authority Byelecion Results - June 2013". Retrieved 19 November 2019.
- ↑ "Past election results". Plymouth City Council. Retrieved 19 November 2019.
- ↑ "Labour hold Stoke ward seat in Plymouth by-election". Plymouth Herald. 27 July 2018.
- ↑ "Local Authority Byelecion Results - July 2018". Retrieved 19 November 2019.
- ↑ "Local Elections Archive Project — Moor View Ward". www.andrewteale.me.uk. Retrieved 5 December 2023.
- ↑ "Local Elections Archive Project — Plympton Chaddlewood Ward". www.andrewteale.me.uk. Retrieved 5 December 2023.
- ↑ "Local Elections Archive Project — Efford and Lipson Ward". www.andrewteale.me.uk. Retrieved 5 December 2023.
- ↑ "Local Elections Archive Project — Plymstock Dunstone Ward". www.andrewteale.me.uk. Retrieved 5 December 2023.
- ↑ "Local Elections Archive Project — St Peter and the Waterfront Ward". www.andrewteale.me.uk. Retrieved 5 December 2023.
External links
This article is issued from Wikipedia. The text is licensed under Creative Commons - Attribution - Sharealike. Additional terms may apply for the media files.