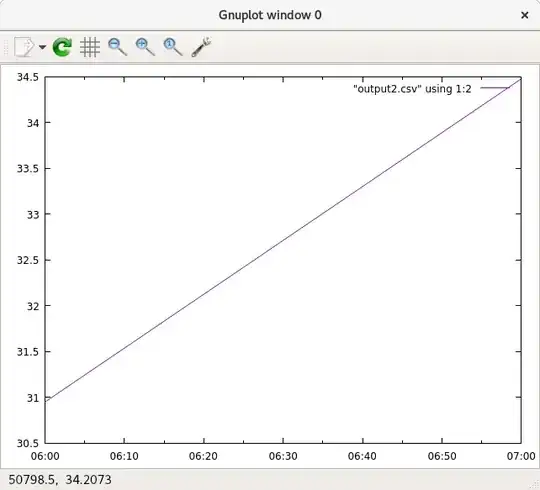
I am working with gnuplot to show simple data on a graph.
My datafile (output.csv) looks like this:
14:06,30.947
14:07,34.476
The first column is time the second column is data. To get this out in a graph i used these commands in gnuplot:
set timefmt "%H:%M"
set xdata time
set datafile separator ','
plot "output2.csv" using 1:2 with lines
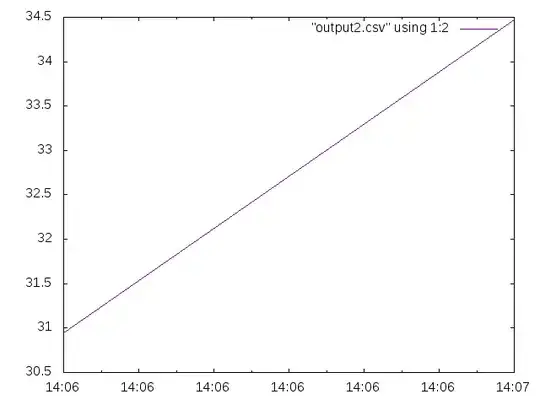
Now when i do this my graph looks like this:

Now as you can see my x axis only takes the minutes not the hours. Why does this happen?
