Questions tagged [gnuplot]

gnuplot can create high-quality graphs and diagram for functions and data.

gnuplot is a command-driven interactive function plotting program. It can be used to plot functions and data points in both two- and three-dimensional plots in many different formats. It is designed primarily for the visual display of scientific data.

Home page: http://www.gnuplot.info/
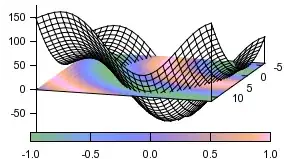
example plot

56 questions
47
votes
3 answers

gnuplot not showing the graph window

I am using gnuplot under ubuntu 12.10. When i type in terminal : gnuplot> plot sin(x) it only shows next step: gnuplot> but it doesn't show the graph plotting windows. What can I do to find the problem?
sourav
  • 471
4
votes
1 answer

GNUPLOT remove overlapping between xtick labels

In GnuPlot, i am setting xtics to something like this: set xtics ("AIM" 0.00000, "gtalk" 2.00000, "rtp-multicast-filetransfer" 4.00000, "sipc_music" 6.00000, "skype1" 8.00000, "skype2" 10.00000, "voip-extension" 12.00000,…
skypemesm
  • 665
3
votes
0 answers

problems with gnuplot in 14.10

some of the useful terminal types (wxt or qt) do not exist. With previous versions of gnuplot and ubuntu, wxt worked well. However, Debian apparently dropped support for wxWidgets 2.8, so gnuplot no longer has an option for the wxt terminal type. …
keving
  • 31
2
votes
3 answers

GNUPlot: Terminal set unknown

G N U P L O T Version 4.6 patchlevel 4 last modified 2013-10-02 Build System: Linux x86_64 Copyright (C) 1986-1993, 1998, 2004, 2007-2013 Thomas Williams, Colin Kelley and many others gnuplot home: …
Sheetal V
  • 21
  • 1
  • 1
  • 2
2
votes
2 answers

simple example of gnuplot

I want to write gnuplot command for a file which just I have one column of that. In the file and that column is Y, But in the file I don't have X's column.X's column element are 1 2 3 4 5 6 7 .Pay attention to the belowe think they are my in file…
Mohammad Reza Rezwani
  • 10,286
  • 36
  • 92
  • 128
1
vote
1 answer

I use gnuplot to output png but cannot open the png pictures

I use gnuplot to out put a png picture. Then the picture has been generate, but I cannot open it. What's the reason? I can open other png pictures on the ubuntu. #! /usr/bin/gnuplot set terminal emf size 1280,960 font…
Ma Xiaoyao
  • 11
  • 1
  • 3
1
vote
1 answer

Gnuplot error while CalcHEP process

I dont know if this is the wright place to ask but school's server gave the error below while doing a process in Calchep batch mode. Its obviously about gnuplot but I have no idea since I didnt touched program's code. set term png transparent…
jackaraz
  • 575
1
vote
1 answer

gnuplot: how to set grid as cylindrical grid

Is that possible to set cylindrical grid (polar grid + z in the 3rd dimension)? Or I have to draw it manually (how?)
WildBaker
  • 133
  • 6
1
vote
2 answers

cannot plot graph in gnuplot-x11

I am using gnuplot under ubuntu 12.04. When i type in terminal : Terminal Type Set to 'unknown' gnuplot> plot sin(x) it only shows next step: gnuplot> but it doesn't show the graph plotting windows. What can I do to find the problem? I have…
Anindya
  • 11
  • 1
  • 5
1
vote
1 answer

Gnuplot - Plot data points on 2D contour plot

I want to plot some data points (M_Coord_Plain.txt) onto a 2D contour projection (which is made by data on Contours.txt). I have found similar answers on these posts: How to mark some points on 2D heat map in gnuplot?, Overlaying points onto a pm3d…
0
votes
1 answer

Gnuplot timefmt not working

I am working with gnuplot to show simple data on a graph. My datafile (output.csv) looks like this: 14:06,30.947 14:07,34.476 The first column is time the second column is data. To get this out in a graph i used these commands in gnuplot: set…
Cyber_Star
  • 903
  • 1
  • 9
  • 27
0
votes
1 answer

How do I plot very big dat file in gnuplot?

I have a .dat file with 50000 rows and 101 columns and try to plot in GNUPLOT by using command **plot "test.dat" matrix with image" **. But no plot occurs . PLz help.
Bapi Saha
  • 459
  • 3
  • 11
  • 25
0
votes
1 answer

saving gnuplot figure without displaying the plot

I have a data file (data.txt). I can plot the data with using gnup command. Like; gnup -p data.txt -xl 'Hours' -yl 'Data (m)' I need to save the plot (for example png format) after executing above command without plotting the data. Is that…
deepblue_86
  • 1,194
0
votes
1 answer

Setting x ascis in gnuplot

I want to write gnuplot plot with a file which has just one column. My file is missing X. My X is based on a row of numeber which go from 2.5 to 30 with a step of 0.1. Is there a command in gnuplot which does that?
0
votes
2 answers

Problem with Gnuplot

I want to draw graphs with Gnuplot. But when I click the button for the example plot sin (x), the gnuplot command window does not appear. I don't know the cause of that behavior
1
2